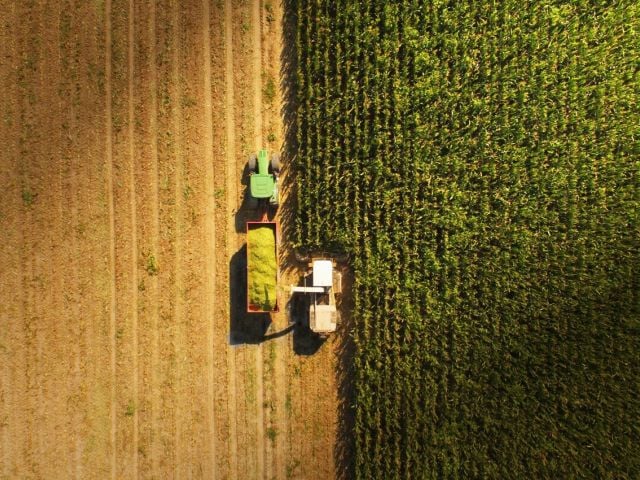
Genetically engineered crops, or GMOs, have led to an explosion in growers’ use of herbicides, with the result that children at hundreds of elementary schools across the country go to class close by fields that are regularly doused with escalating amounts of toxic weed killers.
GMO corn and soybeans have been genetically engineered to withstand being blasted with glyphosate – an herbicide that the World Health Organization recently classified as “probably carcinogenic to humans.” The proximity of many schools to fields blanketed in the chemical puts kids at risk of exposure.
But it gets worse.
Overreliance on glyphosate has spawned the emergence of “superweeds” that resist the herbicide, so now producers of GMO crops are turning to even more harmful chemicals. First up is 2,4-D, a World War II-era defoliant that has been linked to non-Hodgkin lymphoma, Parkinson’s disease and reproductive problems. Young children are especially vulnerable to it.
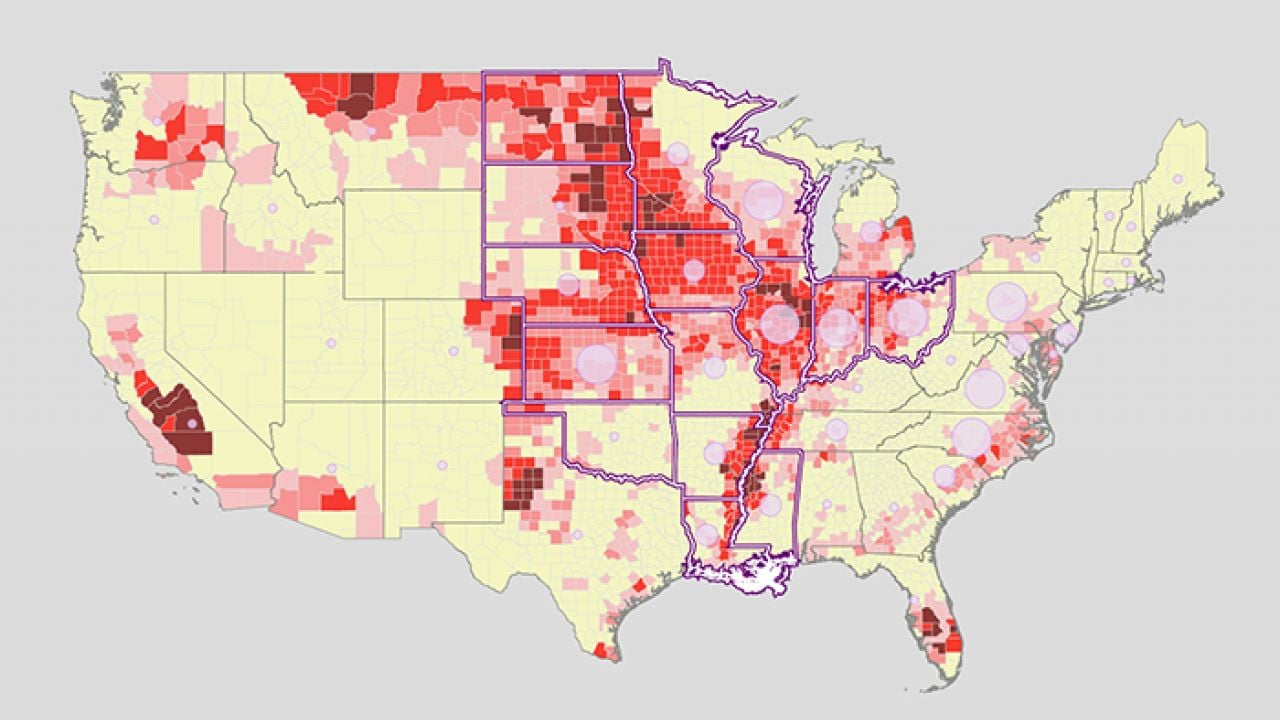
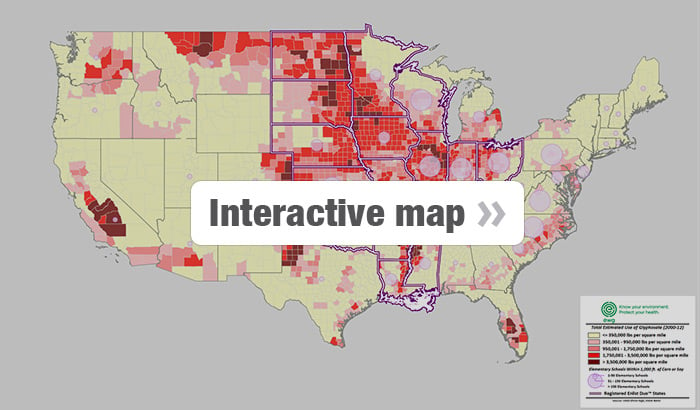
A new EWG interactive map shows the amounts of glyphosate sprayed in each U.S. county and tallies the 3,247 elementary schools that are located within 1,000 feet of a corn or soybean field and the 487 schools that are within 200 feet. Click on any county on the map to see how much GMO corn and soy acreage has increased there as well as the number of nearby elementary schools.
The 15 states outlined on the map across the center of the country are the ones where the Environmental Protection Agency has approved the use of Dow AgroSciences’ Enlist Duo – a combination of glyphosate and 2,4-D – on GMO corn and soybeans engineered to tolerate both weed killers.
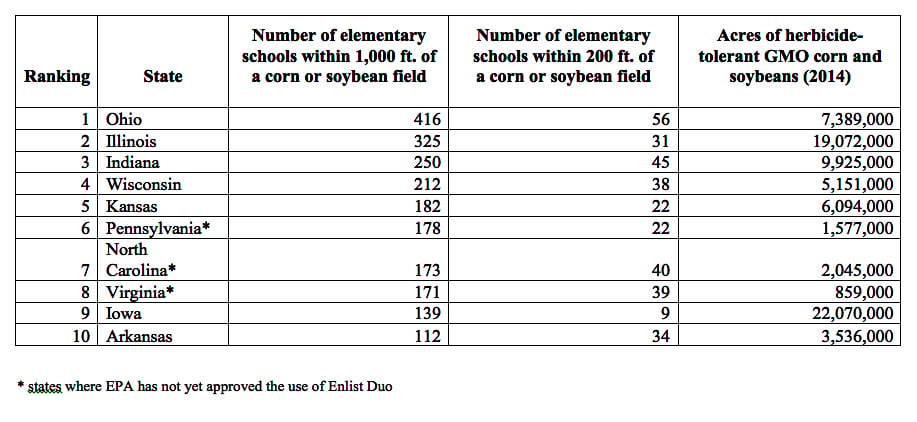
The chart shows the 10 states with the most elementary schools within 1,000 feet of a corn or soybean field. These states account for 53 percent of the total acreage planted with genetically engineered GMO corn and soy. EPA has approved the use of Enlist Duo in seven of them.
The inescapable connection between GMO crops and increased use of toxic herbicides is one reason why many people want to know whether the products they buy contain GMOs. Polls show that more than 90 percent of consumers favor labeling GMOs, but without a mandatory labeling law, they have no way to know for sure.
Methodology:
EWG approximated school locations using the ESRI (www.esri.com) landmark shape file for schools, derived from the U.S. Geological Survey Geographic Names Information System – Schools layer. These are considered the best available data for school locations. The data were filtered to the best of EWG’s knowledge to include only locations whose attributed name reflects an operating elementary school, but they may inadvertently include some free-standing school administrative offices or buildings that formerly housed schools but are now in other use.
Zones within 200 feet and 1,000 feet of each school were delineated using the school’s point location in the ESRI data, not the physical footprint of the school grounds. As a result, EWG’s analysis may over- or under-estimate the exact distance of school grounds to the boundaries of nearby corn or soybean fields. School locations were evaluated for proximity to the boundaries of corn and soybean fields as delineated in the USDA 2013 cropland data layer (30-meter resolution).
EWG acknowledges that spatial analyses of this kind may include some level of error (such as incorrect or outdated school or crop field locations or boundaries) even with standard, best available data sources. EWG welcomes information to revise and correct any locational errors in the underlying data.
Data on estimated glyphosate use was drawn from the U.S. Geological Survey’s Estimated Annual Agricultural Pesticide Use for Counties of the Conterminous United States (2008-2012 & 1992-2009). According to the USGS, “Pesticide use estimates from this study are suitable for making national, regional, and watershed assessments of annual pesticide use, however the reliability of estimates generally decreases with scale.”
Data on the acreage of genetically modified corn and soybeans were assembled by extrapolating from county-planted acreage using state percentages of biotech varieties by crop, as reported by the USDA. For corn, state level “herbicide resistant” + “stacked gene” varieties were used to extrapolate county-level planted acreage. If a state was not specifically listed in the USDA NASS Acreage Report, the category “Other” was used in the extrapolation. For soybeans, the state-level “all biotech varieties” was used to extrapolate planted acres at the county level. If a state was not specifically listed in the USDA NASS Acreage Report, the category “Other” was used in the county extrapolation.