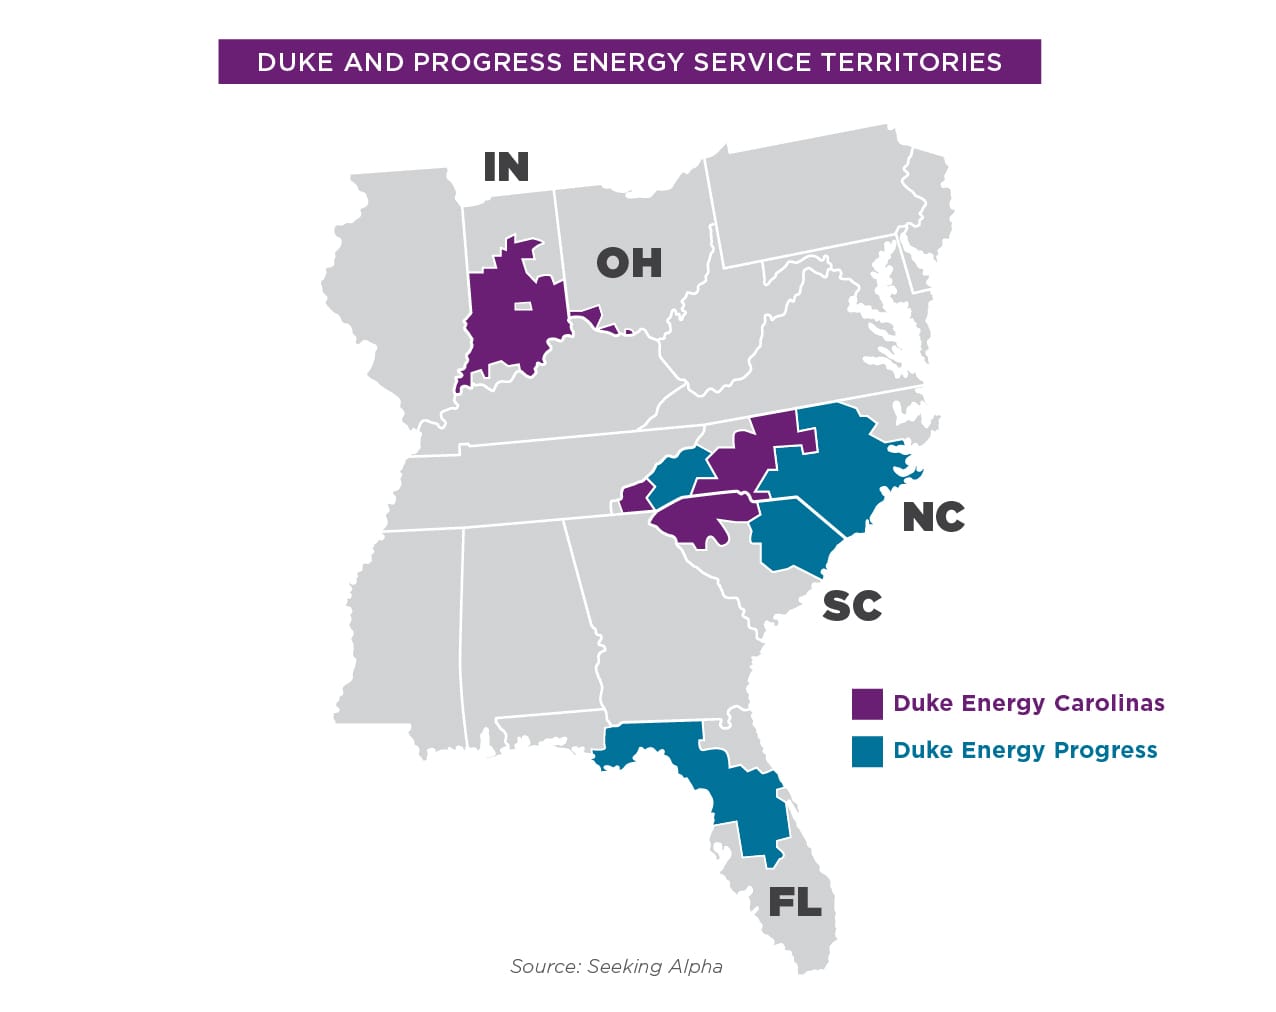
Duke Energy is the largest investor-owned electric utility in the U.S., serving 7.7 million customers in North and South Carolina, Florida, Indiana, Ohio and Kentucky. But a deep dive into Duke’s actions, portfolio and regulatory filings reveals another distinction: Considering its size, environmental record, puny investments in solar and wind power, and schemes to penalize customers who want to join the renewable energy revolution, Duke is public energy enemy No. 1.
In its 2017 Sustainability Report,1 Duke boasted that it is reducing air and water pollution from its power plants, expanding its use of renewable energy and working to “improve the lives of our customers and vitality of our communities.” The utility has even registered the slogan “Building a Smarter Energy Future.” Duke titles its current annual report “Transforming the Future.” Here are the facts:
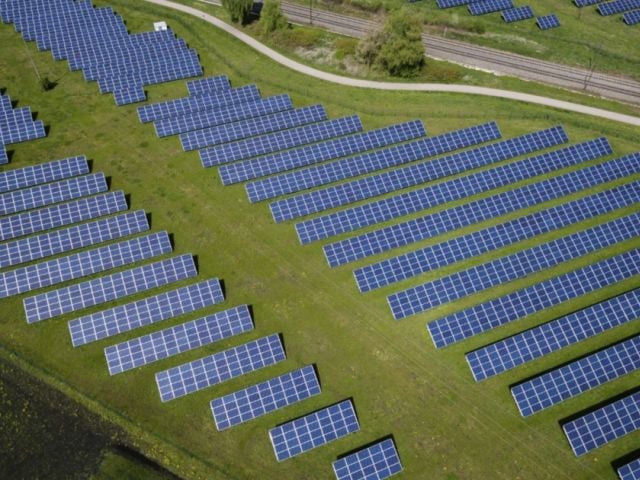
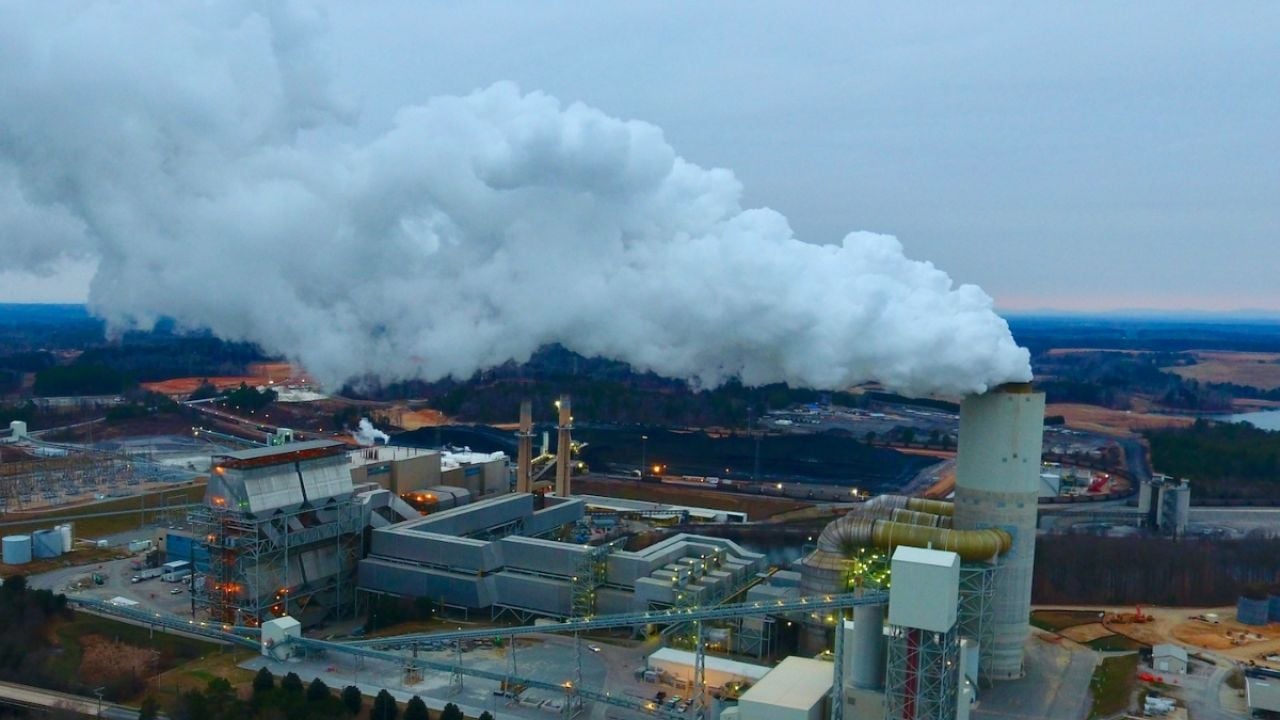
- Dirty coal-fired power plants and risky nuclear reactors generate almost 70 percent of Duke’s electricity, far more than the national share of about 50 percent. Across all service areas where Duke has a government-protected monopoly, solar and hydro power generate 2 percent of its electricity.
- Forced by Environmental Protection Agency lawsuits to reduce its reliance on coal, Duke is staking its future on natural gas power plants and pipelines. Extraction of natural gas relies on fracking, a major source of water and air pollution and a severe threat to public health, and the extraction, transport and burning of natural gas emits methane, a much more powerful global warming gas than carbon.
- Duke is systematically undermining customers’ ability to generate their own solar power and their savings from customer-owned solar and energy efficiency investments.
Based in Charlotte, N.C., Duke operates in so many state and regional markets – each with a different set of rates and rules – that regulators, journalists and consumers don’t often get a complete picture of what the behemoth is planning and doing. But EWG’s months-long investigation reveals a master plan sharply at odds with America’s urgent need to turn away from outdated energy sources that fuel climate change and threaten public health.
Across the nation, forward-looking utilities are accelerating the development of cheaper, cleaner and safer renewables, energy storage and efficiency, and phaseout of expensive, dirty and dangerous coal, nuclear and natural gas plants. But Duke is seeking to slow the pace of transition to renewables. It wants to retain control of power generation and to protect its own power plant investments against competition and cheaper alternatives.
Duke’s government-protected monopolies allow it to pass on to customers the cost of expensive, centralized power plants. These monopolies are relics of an age when regulators wanted to extend electric service quickly to as many people as possible, so they guaranteed utilities exclusive territories and a fair return on investments in new facilities.
But in an era offering multiple, ever-expanding and decentralized sources of energy, this model is an incentive for Duke to keep conventional power front and center, relegating renewables and efficiency to the fringes. This increases Duke’s short-term profits for its stockholders2 but at the expense of ratepayers’ pocketbooks and health, and the nation’s energy future.
How Duke Makes Money
In 2018, Duke’s net income from its electric utility subsidiaries in North and South Carolina, Florida, Ohio and Indiana was about $2.6 billion on revenues of $22.5 billion – an 11.5 percent profit margin. Its plants, equipment and property were valued at $78.6 billion.
In the Carolinas, Florida, Indiana and Kentucky, Duke is a regulated monopoly.3 In its exclusive service territories, Duke owns the plants that generate electricity and the transmission and distribution systems that carry it to customers. State regulators, appointed by the governor and confirmed by legislators, must approve a utility’s investments in new plants. The regulators then set electricity rates to cover the costs of generating and delivering power, plus a guaranteed rate of return on its investments.
This means Duke’s customers are obligated to pay for whatever type of power plant the company, wielding its tremendous political clout, can persuade regulators it needs to build.4 It also gives Duke a powerful incentive to pad its profits by building plants it owns and operates – the more expensive, the better – and to discourage customers from generating their own power by installing solar panels or from saving energy through efficiency measures. The more inefficient the electric system, the more Duke, or any other regulated utility, profits.
Companies traded on the stock market must file an annual report with the federal Securities and Exchange Commission, disclosing risks to their bottom line that investors should be aware of. Duke’s SEC filing for 2018 makes clear that it sees the trend toward renewables, efficiency, customer control and environmental sustainability as threats to its profit margin. Duke warns:
- State and federal laws mandating greater efficiency will reduce demand for electricity, sticking the company with “stranded costs” it may not be able to recoup from customers.
- Demand will drop as cheaper prices for solar panels, wind turbines and other forms of “distributed generation” empower customers and local communities to generate their own electricity, freeing them to leave Duke’s system entirely.
- The expansion of net metering will let solar customers send the electricity they generate back into Duke’s system and receive a credit on their monthly bills.
- The costs of cleaning up millions of tons of toxic coal ash pollution could damage its “reputation” and “financial position.”5 And there are “substantial” costs and liabilities associated with owning nuclear plants and safeguarding the radioactive waste left behind, including the “uncertainties with respect to the technological and financial aspects of decommissioning nuclear plants at the end of their licensed lives.”
Undermining Customer Choice and Savings
To undercut the customer incentive to invest in energy efficiency or install rooftop solar to cut electric bills, Duke has used two main strategies: derailing or weakening net metering and raising the fixed monthly customer charge.

Net metering
Net metering works like this: Rooftop solar panels are connected to the home’s electric meter. The meter measures the electricity the customer uses from the utility’s distribution system and how much was generated from the customer’s own solar panels. The utility credits the customer for the solar-generated power returned to the grid and sold to other customers at the same rate it charges for the power it delivered.
Utilities argue that this means solar customers aren’t paying their fair share of costs of the distribution system. But independent studiesshow that solar installations benefit all customers by reducing the need for expensive new generation and distribution systems. California regulators estimate that customers’ investments in rooftop solar and efficiency have averted $2.6 billion in transmission and distribution costs for utilities – costs that would have been passed on to customers.

Fixed charges
Most of the monthly bill for all but the largest users consists of variable charges – how much electricity is used, the costs of power plants and the distribution system, and the utility’s profit margin as set by regulators.
The fixed customer charge is the part of the bill intended to cover administrative costs – the cost of installing and reading meters, billing, and the poles and lines that connect the home to the distribution system. Fixed charges have historically run about $5 to $10 a month, depending on the number of customers served.
Utilities can try to discourage customers from going solar by paying them a much lower rate for power sent back to the grid than they charge for power supplied by the grid, or by eliminating net metering altogether. Utilities can raise the fixed monthly charge. Or they can assess solar customers so-called demand charges, based not on actual electricity used but on the customer’s highest demand for the month.
Duke has relentlessly pushed state regulators to let it implement these and other tactics to punish customers for going solar or investing in energy efficiency.
- In South Carolina, Duke derailed 2018 legislation that would have lifted the cap limiting net metering to customers representing 2 percent of utility sales. The state hit the cap that summer, causingnew solar adopters to receive less compensation for their contributions to the grid. In Indiana, Duke and its allies in 2017 pushed through legislation to eliminate net metering by 2022.
- In its home state of North Carolina, since 2013 Duke has been allowed to more than double the flat monthly charge, from $6.75 to the current $14. In 2015, the utility lobbied successfully to kill legislation that would have made it easier for customers to borrow and pay back the cost of solar panels, and to stop the extension of a renewable energy tax credit. Duke supported recently passed legislation allowing utilities to add demand charges to solar customers’ bills, if approved by regulators. Duke also worked to severely weaken North Carolina’s implementation of the Public Utility Regulatory Act, a federal law requiring utilities to purchase power from independent developers of solar, wind or other forms of renewable energy.
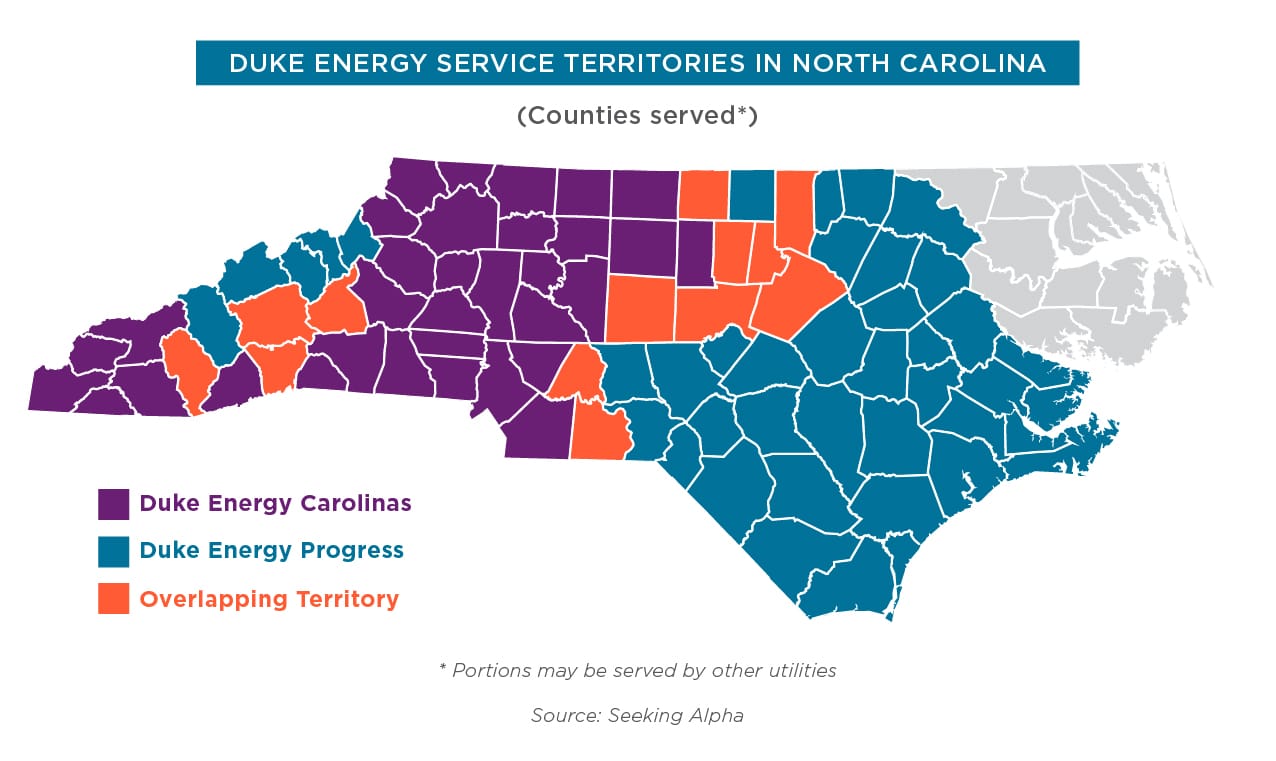
- Duke has two subsidiaries in the Carolinas: Duke Energy Carolinas and Duke Energy Progress, a legacy of its 2012 merger with Progress Energy. In November 2018, the two utilities separately asked South Carolina regulators for major increases in their flat monthly customer charges. Duke Energy Carolinas is seeking an increase from $9.06 to $29, and Duke Energy Progress wants an increase from $8.29 to $28. In 2018, Duke also killed a bill that would have expanded net metering, limiting the number of customers who could participate.
- Based on a proposal from Duke, in 2014 Florida regulators rolled back the state’s energy efficiency goals by 90 percent and eliminated rebates from the utility to customers who invest in solar panels.
- In Indiana, the lobbying group for the state’s large utility companies, including Duke, successfully killed the statewide energy efficiency program. Last year a study estimated that Indiana ratepayers will pay $140 million more from 2015 through 2019 than if the program had stayed in place. In 2017, the lobby group secured passage of a bill to sharply reduce the rate customers are paid for power sent to the grid.
- In Ohio, Duke sought in 2017 to increase the flat monthly customer charge from $6 to $22.77, but regulators rejected the request after pushback organized by Ohio Citizen Action and the Sierra Club turned out customers to public hearings, and thousands of letters and postcards against the fixed rate increase were filed with the state public utilities commission.
Slowing the Transition to Renewable Energy
In 2018, coal-fired power plants generated about 31 percent of Duke’s electricity. Nuclear reactors supplied about 33 percent, and 34 percent came from plants burning natural gas or fuel oil. Solar and hydro power supplied 2 percent. Duke owns no wind power in its regulated territories. These percentages include purchased power, which makes up about 7 percent of Duke’s energy mix. A small portion of Duke’s purchased power is from renewable sources.
The generation mix is shifting – but not nearly fast enough to allow Duke’s customers to take full advantage of the tremendous potential for renewable energy in its territories, or to reduce greenhouse gas emissions quickly enough to head off catastrophic climate change. Duke planning documents filed with state regulators show:
- Although it has been forced by economics, lawsuits and tighter emissions regulations to close some dirty, money-losing coal plants, Duke will continue to rely on coal as a significant source of its generation mix for another decade or more. Duke opened a new coal plant in North Carolina in 2012 and another in Indiana the following year. In Indiana, it plans for coal to provide more than 60 percent of its electricity in 2035. In the Carolinas, Duke’s last currently operating coal plant won’t close until 2048.
- Nuclear is Duke’s dominant energy source in the Carolinas, with 11 reactors in six power plants generating 52 percent of electricity. By 2033, the share of nuclear power in those states is projected to decline only slightly, to 46 percent. In 2017, Duke canceled construction of two new reactors in South Carolina, although it retained their federal license, for potentially reviving the project in the future.
- Duke is staking its future on fracked natural gas. In 2017, the utility said gas “will play a major role in Duke Energy’s clean energy future” ¬– not acknowledging the mounting evidence of the health hazards of natural gas production and its significant contribution to climate change. And heavy reliance on natural gas will continue. Duke is investing billions of dollars in new natural gas plants and pipelines. Natural gas will increase to supply more than three-fourths of Duke’s generation in Florida by 2027 and more than a third in the Carolinas by 2033.
These investments in coal, nuclear and natural gas come at the expense of more aggressive expansion of cleaner and affordable renewable energy, energy efficiency and storage batteries.

Renewables
In the Carolinas, renewables provide only about 3 percent of Duke’s electricity generation. By 2033, that is projected to increase to just 8 percent. In Florida, the Sunshine State, Duke has no solar generation, rising to less than 10 percent in 2027. In Indiana, renewables and efficiency are projected to supply just 13 percent of Duke’s energy by 2035.
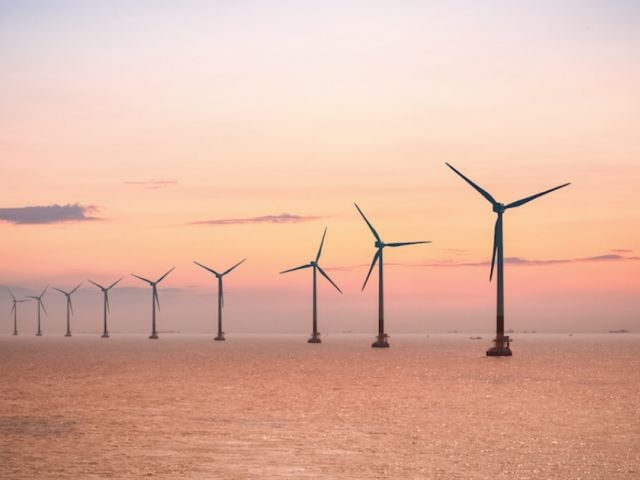
The most glaring hole in Duke’s renewables portfolio is wind power. Duke owns wind projects that sell power on the wholesale market and buys some wind power for resale in Indiana. But it has no wind generation in its monopoly territories.
The utility says it’s too difficult to site wind turbines in the Carolinas. In 2010 Duke abandoned a plan to build three turbines offshore in North Carolina and more recently rejected a bid for a contract to purchase wind power in the two states. Duke’s planning documents project very little expansion of wind power. Advocates led by Southern Alliance for Clean Energy recently filed testimony criticizing Duke’s most recent planning document, asserting that retiring coal plants early, avoiding new natural gas plants and shifting aggressively to renewables would be over $5 billion less expensive than their business plan.
Duke makes specious arguments for its tepid solar program and its shunning of wind. It says renewables are unreliable – that their “power output is intermittent.” It’s true that solar and wind output vary depending on the time of day and weather conditions, but their generation overall is predictable. The declining cost of storage batteries means far less natural gas capacity is needed for peak demand times: Prices for projects combining solar and storage are now often cheaper than new natural gas plants. This trend has rapidly accelerated in recent years, but Duke didn’t announce its first pilot storage project until last fall. Over the next 15 years, Duke plans to add more than 40 times as much natural gas generation as storage capacity in the Carolinas.
The potential for renewables in Duke’s territories is huge. The technical potential for wind off the North Carolina coast is almost five times what the state’s power plants currently supply to the grid, and off the South Carolina coast, almost eight times more.
Using data from federal agencies and the solar industry,6 EWG calculated that in each state Duke serves, except Florida, the potential of wind and solar power far exceeds electricity demand. Technical potential isn’t necessarily economic potential, but even installing a small percentage of that potential would significantly alter the energy mix in Duke territories in favor of renewables. (See Appendix 1 for our calculations.)

Efficiency
Duke’s efficiency investments also leave much to be desired. In states with an efficiency mandate, Duke complies with the law but goes no further. In territories without a standard, Duke simply maintains its existing programs, ignoring the potential for energy and customer savings.7
EWG applied data from the Energy Information Administration to the methods used to compile the annual scorecard of the American Council for an Energy-Efficient Economy. We calculated that the overall efficiency score for Duke across all its territories is only one out of four – a failing grade by any standard. (See Appendix 2 for our calculations.)
In Indiana, Duke’s 2015 planning documents downplay the potential gain from efficiency by assuming that solar costs will remain the same for 20 years and severely underestimating the capacity of wind turbines. The documents also manipulate data to make Duke’s money-losing coal plants seem cheaper to operate than they really are.
“Grid modernization” scheme
Energy storage and efficiency, rooftop solar, and other strategies such as demand response8 can much more cheaply displace or postponecostly transmission and distribution upgrades. But instead of investing in these money-saving technologies, in the Carolinas Duke is seeking regulators’ approval for “grid modernization” – costly improvements to the existing system whose costs it would pass on to customers. This strategy is by no means limited to Duke: A November 2018 study by The Brattle Group found that electric utilities across the U.S. are overspending by billions to upgrade transmission lines and other equipment.
Two versions of Duke’s plan have been rejected – the first by the legislature; the second by regulators – but the utility is still asking. The public interest groups Appalachian Voices and NC Warn say Duke claims the plan would prepare the electric grid for more renewables but is “actually impeding the growth of renewables and storage.”
Duke’s Power Mix Is Unhealthy and Unsafe
Duke’s heavy reliance on conventional power plants – whether coal, natural gas or nuclear – poses serious hazards to public health and safety.

Coal
In 2016, the Center for Public Integrity ranked America’s 100 worst “super-polluting” coal plants by two measures: emissions of toxic air contaminants, and of carbon dioxide and other greenhouse gases. Duke’s Gibson plant, in Owensville, Ind., and its Crystal River, Fla., plant made both lists. Gibson was ranked as the nation’s worst super-polluter overall. Crystal River ranked fifth but was closed in December 2018. The Duke plant in Belews Creek, N.C., ranked as one of the worst emitters of carbon dioxide.
Environmental Protection Agency data show that in 2016, Gibson emitted 15.3 million metric tons of carbon dioxide and 1.4 million pounds of toxic air contaminants. Crystal River emitted 8.8 million metric tons of carbon dioxide and 650,000 pounds of toxics. Belews Creek emitted 10.5 million metric tons of carbon dioxide.
In 2000 the EPA sued Duke for failing to notify the agency of modifications to coal-fired generation units that increased emissions, which would require the plants to meet tougher clean air standards. A consent decree mandated the shutdown of 13 coal units by 2024, and the retrofitting of two others.
Nationwide, coal plants generate more than 100 million tons of coal ash each year, which is laden with toxics like mercury, cadmium and arsenic. In North Carolina, Duke stores 110 million tons of coal ash in unlined pits.
In 2014, a Duke coal ash pit spilled 39,000 tons of ash into North Carolina’s Dan River. The EPA fined the company $102 million, and state regulators fined it an additional $100 million, finding “pervasive system-wide shortcomings” in dealing with coal ash. Duke recently notified the EPA that 24 of its coal ash pits violate federal regulations protecting underground aquifers and wetlands. After Hurricane Florence last year, flooding released an estimated 150 dump truck loads of toxic sludge from a coal combustion waste pit into the Cape Fear River. Despite this malfeasance, in 2016 Duke was behindlegislators’ weakening of the state’s coal ash laws.

Natural gas
Contrary to Duke’s assertion that natural gas is a clean, low-carbon fuel, in fact it is a significant contributor to climate change. U.S. utilities are building so many new natural gas plants that last year, more carbon was emitted from natural gas operations than from coal plants. The production, transport and burning of natural gas all emit methane, a much more potent greenhouse gas than carbon dioxide.
Evidence is also mounting that the natural gas boom is a severe hazard to human health.
Natural gas production depends on fracking, which uses and releases large quantities of toxic chemicals, often near homes and schools. A recent report by health professionals and advocates concluded that not only are current fracking regulations inadequate to protect Americans from increased risk of cancer, asthma and birth defects but also that there is no evidence fracking can ever be done without threatening public health. Studies show that babies born near fracked wells are more likely to suffer low birth weight and birth defects.
![]()
Nuclear
The federal Nuclear Regulatory Commission, or NRC, defines near misses as mishaps that can increase the risk of a reactor meltdown by 10 times. In 2016 Greenpeace documented 166 near misses at U.S. nuclear reactors over the previous 10 years, including events at four Duke plants. Two particularly egregious examples were at Duke’s Oconee Nuclear Station, in South Carolina.
In 2012, an NRC whistleblower revealed that Duke officials had known since the early 1990s that the Oconee structure housing equipment to cool the reactors during a blackout would have been flooded if an upriver dam failed. The structure was determined not to be high enough to withstand such a flood. In 2016, Oconee workers found that a backup power supply, needed to cool the reactor in an emergency shutdown, wasn’t connected to the plant.
In 2012, the Associated Press reported that three-fourths of U.S. nuclear plants had leaks of radioactive tritium and that “[t]he number and severity of leaks has been escalating, even as federal regulators extend the licenses of more and more reactors across the nation.” From 2007 to 2010, all but two of Duke’s nuclear plants reported tritium leaks, including a 100,000 gallon spill at the McGuire plant, in North Carolina.
For decades the NRC has colluded with the nuclear industry to weaken safety standards to keep aging reactors running. The chances for a major accident increase because of wear and tear on parts from extreme heat and radiation exposure. David Lochbaum, a nuclear engineer and former nuclear safety director at the Union of Concerned Scientists, estimates that, for every 100 reactors, the chances of a meltdown for 40-year-old unit or reactor is 33 percent, for those at 60 years, 45 percent.
Duke owns six nuclear plants in North and South Carolina, with a total of 11 reactors. Four are more than 40 years old. The rest range in age from 32 to 38 years. According to Duke’s federal regulatory filings, all its reactors are expected to run for or nearly 60 years.
References
1 The 2018 Sustainability Report was not available by the deadline for publication of this report.
2 By law, Duke is obligated to work in the interest of its stockholders. But in light of the energy market’s inexorable transition to renewables, and the climate change, public health and pollution risks of natural gas plants, pipelines and nuclear reactors, Duke’s current and planned reliance is not in its shareholders’ long-term interests.
3 Ohio is a deregulated state that allows customers to choose where their power comes from. However, Duke owns local distribution systems in its Ohio service territory that are regulated.
4 Campaign finance records compiled by the Energy and Policy Institute show that from 2008 to 2018, Duke gave more than $6.5 million to independent expenditure groups for Republican and Democratic gubernatorial, attorneys general and legislative candidates. That was the most contributed to those groups of any of the 75 utility companies in the analysis.
5 For example, in early April, the North Carolina Department of Environmental Quality ordered Duke to excavate 11 coal ash storage ponds and move the waste to lined landfills or recycle it. Estimated cost is $4 billion to $5 billion, on top of the $5.6 billion Duke is spending on coal ash cleanup.
6 The Energy Department and its WINDExchange program, the Energy Information Administration, the National Renewable Energy Laboratory and the Solar Energy Industries Association.
7 See intervenor testimony in Indiana and North Carolina at https://www.in.gov/iurc/files/CAC_Earthjustice_et_al.pdf and http://www.ncwarn.org/wp-content/uploads/NC-WARNs-Initial-Comments-on-IRPs.pdf
8 Demand response technology allows a utility to cycle a customer’s air conditioning, central heat and water heater on and off during periods of peak demand, in exchange for lower rates or other financial incentives.
Appendix 1. Wind and Solar Potential in Duke Energy’s Regulated States
This chart shows the technical potential for solar and onshore wind in states where Duke has monopoly territories, based on data derived from federal and private sources. The technical potential far exceeds each state’s electric demand for solar, and for wind in every state but Florida. However, solar potential in Florida is enormous and is much greater than current state of electric generation.
Technical potential is not economic potential. Although studies analyzing technical potential take into account areas where development wouldn’t be feasible, not all technical potential for wind and solar will be built. But the data show that development of only a modest portion of technical potential would meet a substantial portion, and in some cases almost all, of each state’s electric demand.
Moreover, the National Renewable Energy Laboratory data for solar is from 2012. Since then, solar costs have dropped substantially. Solar panels are becoming more efficient. In addition, hub heights for wind are now reaching 100 meters as the norm, whereas the data used here is 80 meters, and other technological advances allow for greater capacity factors.
Technical potential for wind and solar will only increase with anticipated cost reductions and technological advances, which also drive economic potential.
Current Capacity and Technical Potential for Wind and Solar in Duke’s Territories
(Capacity in megawatts; generation in megawatt-hours. Potential for wind and solar is technical potential.)
| State | Current Installed Wind Capacity1 | Onshore Wind Potential Installed Capacity2 (at 80 meters) | Onshore Wind Potential Generation3(million MWhs) | Current Installed Solar PV Capacity4 | Solar Potential Installed Capacity (rooftop, urban, rural*)5 (millions of MWhs) | Solar Potential Generation6(billions of MWhs) | State 2016 Net Electric Generation7(millions of MWhs) |
|---|---|---|---|---|---|---|---|
| North Carolina | 208 | 78,000 | 177 | 4,412 | 2.4 | 4.3 | 130.8 |
| South Carolina | 0 | 42,000 | 75 | 531 | 1.6 | 2.8 | 97.0 |
| Florida | 0 | 38,000 | 75 | 1,893 | 3.7 | 5.3 | 238.3 |
| Indiana | 2,117 | 118,000 | 351 | 265.64 | 3 | 4.9 | 101.7 |
| Ohio | 617 | 119,000 | 300 | 156.44 | 2.4 | 3.7 | 118.2 |
Source: EWG, from data by the Energy Department and its WINDExchange program, the Energy Information Administration, the National Renewable Energy Laboratory and the Solar Energy Industries Association.
*Other than rooftop
Appendix 2: Scoring Duke’s Energy Efficiency Programs
This table shows the life-cycle savings for Duke Energy’s energy efficiency programs in its regulated territories. EWG’s methodology is based on the 2017 Utility Energy Efficiency Scorecard of the American Council for an Energy-Efficiency Economy, or ACEEE. Life-cycle savings data is sourced from the federal Energy Information Administration or EIA.
ACEEE uses many indices to score utilities’ programs, but life-cycle savings show the commitment to measures with long-term energy savings. Our score is determined by dividing the combined life-cycle savings for residential, commercial and industrial programs by the total megawatt-hour sales for each Duke subsidiary in 2016. The resulting percentage is then matched with ACEEE’s scoring table, which scored life-cycle savings on a scale of 0 to 4.
ACEEE’s s Scoring System for Life-Cycle Savings
| Scoring for Net Lifetime Savings as a Percentage of Retail Sales | |
|---|---|
| Percent of Retail Sales | Score |
| 32+ | 4.0 |
| 28.00–31.99 | 305 |
| 24.00–27.99 | 3.0 |
| 20.00–23.99 | 2.5 |
| 16.00–19.99 | 2.0 |
| 12.00-15.99 | 1.5 |
| 8.00–11.99 | 1.0 |
| 4.00–7.99 | 0.5 |
| 0.00–3.00 | 0 |
Duke’s combined 2016 sales in its regulated territories is 214,760,536 megawatt-hours. The combined life-cycle savings for those utilities is 19,083,258 megawatt-hours. Therefore, the combined savings is 8.8 percent, for a combined score of 0.92, rounded up to 1.
Duke Energy Subsidiaries Megawatt-Hour Savings from Energy Efficiency Programs in 2016
| Utility | State | Residential Megawatt-Hour Incremental Life-Cycle Savings | Commercial Megawatt-Hour Incremental Life-Cycle Savings | Industrial Megawatt-Hour Incremental Life-Cycle Savings | Total Megawatt-Hour Incremental Life-Cycle Savings | Total Utility Megawatt-Hour Sales | Approximate Percent of Sales for Life-Cycle Savings | Score* |
|---|---|---|---|---|---|---|---|---|
| Duke Energy Progress | N.C. and S.C. | 2,525,365 | 1,838,566 | 0 | 4,363,646 | 43,867,438 | 9.9 | 1 |
| Duke Energy Ohio | Ohio | 937,247 | 1,774,059 | 0 | 2,711,333 | 20,498,646 | 13.2 | 1.5 |
| Duke Energy Carolinas | N.C. and S.C. | 5,083,812 | 3,802,554 | 0 | 8,886,368 | 79,462,909 | 11.2 | 1 |
| Duke Energy Florida | Fla. | 369,045 | 279,383 | 0 | 649,328 | 38,773,961 | 1.7 | 0 |
| Duke Energy Indiana | Ind. | 945,878 | 1,047,740 | 0 | 1,993,618 | 28,058,383 | 7.1 | 0.5 |
| Duke Energy Kentucky | KY | 220,107 | 258,858 | 0 | 478,965 | 4,099,199 | 11.7 | 1.5 |
| AVERAGE OF ALL SCORES | 0.92 | |||||||
Source: EWG, derived from ACEEE8 and EIA.9
*The EWG approach to scoring is much simpler than ACEEE’s and tends to provide higher scores than ACEEE.
Appendix Sources
1 https://windexchange.energy.gov/states
2 https://windexchange.energy.gov/maps-data/321
3 https://windexchange.energy.gov/maps-data/321
4 https://www.seia.org/states-map
5 https://www.nrel.gov/docs/fy12osti/51946.pdf
6 https://www.nrel.gov/docs/fy12osti/51946.pdf
7 https://www.eia.gov/electricity/state/
8 https://aceee.org/research-report/u1707
9 https://www.eia.gov/electricity/data/eia861/