Overview
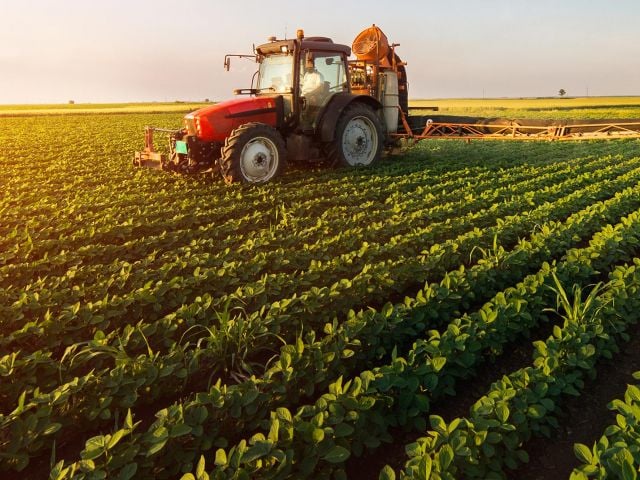
- Irrigated agriculture in seven states is responsible for three-quarters of Colorado River water used.
- The Agriculture Department sent over $6.1 billion to the region’s farmers for drought-related crop losses and agriculture conservation irrigation subsidies.
- Drought and heat in the region will continue to intensify with the climate crisis, and the USDA must help farmers adapt.
As the climate crisis deepens, drought and heat in the Colorado River region are also worsening, wreaking havoc on farms. The Department of Agriculture has a significant role to play in helping farmers in those and other states adapt and become more resilient to climate change – but two major USDA programs do neither, a new Environmental Working Group investigation finds.
The heavily taxpayer-subsidized USDA Crop Insurance Program paid $5.6 billion to farmers for drought-related losses between 2017 and 2023 in the seven Colorado River region states: Arizona, California, Colorado, Nevada, New Mexico, Utah and Wyoming.
During the same period, the USDA paid $521.7 million to farmers in the region to install irrigation practices through the Environmental Quality Incentives Program, or EQIP – one of the department’s largest private lands conservation programs.
Together, the funding from crop insurance and EQIP topped $6.1 billion.
Fully 75 percent of Colorado River water consumed for direct human uses is used by farmers to irrigate crops. Livestock feed crops like alfalfa and other types of hay alone account for almost half – 46 percent – of all river water consumption. In other words, millions of acres of thirsty crops that will feed livestock are being grown in an area running out of water.
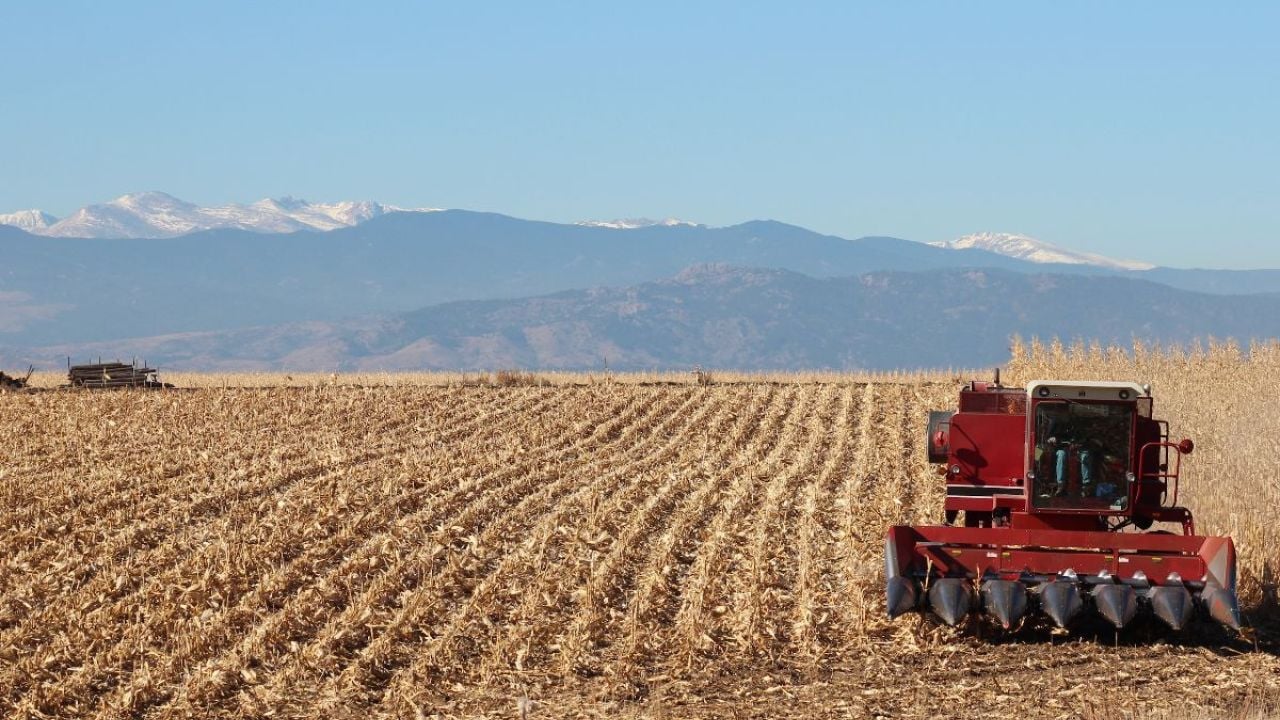
Increased drought and higher temperatures in the region are inevitable, thanks to the climate emergency. In the not-too-distant future, Colorado River state farmers will not be able to farm what and how they farm today.
The USDA’s conservation and crop insurance programs need reform in order to help farmers adapt to drought exacerbated by the climate crisis. The programs must also reduce funding for farming practices that undermine the region’s climate resilience.
Crop insurance paid region’s farmers $5.6B for drought-related losses
Between 2017 and 2023, farmers in the Colorado River Basin states received $5.6 billion in crop insurance indemnities for drought-linked crop losses.
For its analysis, EWG considered insurance indemnities made for a drought-related loss to be payments made for one of four reasons:
- drought
- heat
- a failure in irrigation water supply or irrigation equipment
- payments made through the program for “rainfall index” policies. (Farmers get an insurance payment through a rainfall index policy if their local area receives less rain than long-term averages during part of the growing season.)
Out of the four drought-related payment triggers, rainfall index policies paid out the most money, at 53 percent of indemnities. Failure of irrigation supply or equipment was the second most expensive cause of loss, distributing 20 percent of the total. (See Table 1.)
Table 1. The four types of drought-related crop insurance payments.
Drought-related crop insurance payment categories | Indemnities between 2017 and 2023 | Percent of all drought-related payments |
Rainfall index | $2.96B | 53 |
Failure of irrigation supply/equipment | $1.10B | 20 |
Heat | $0.86B | 15 |
Drought | $0.69B | 12 |
Total | $5.61B |
Source: EWG, from the USDA Risk Management Agency, Cause of Loss Historical Data Files
In the Colorado River states, the USDA crop category “pasture, rangeland, forage” collected the most drought-related crop insurance payments, more than $2 billion – all from rainfall index policies.
Rice, corn and wheat made up the next largest group of crops for which farmers got drought-related indemnities. Farmers of these three commodities received over $1.15 billion in crop insurance payments due to drought, heat and failure of irrigation supply or equipment.
Of the seven states in the region, California collected by far the most payments, $2.1 billion, followed by Colorado, with over $1 billion. (See Figure 1.)
Although much of California’s agricultural land is technically outside of the Colorado River Basin, some of the river’s water is channeled to farms and cities outside the basin. And the increasing drought conditions and dwindling water resources within the basin are consistent through the rest of the parts of the Colorado River states that lie outside the basin.
Figure 1. Colorado River states and drought-related crop insurance payments farmers received between 2017 and 2023.
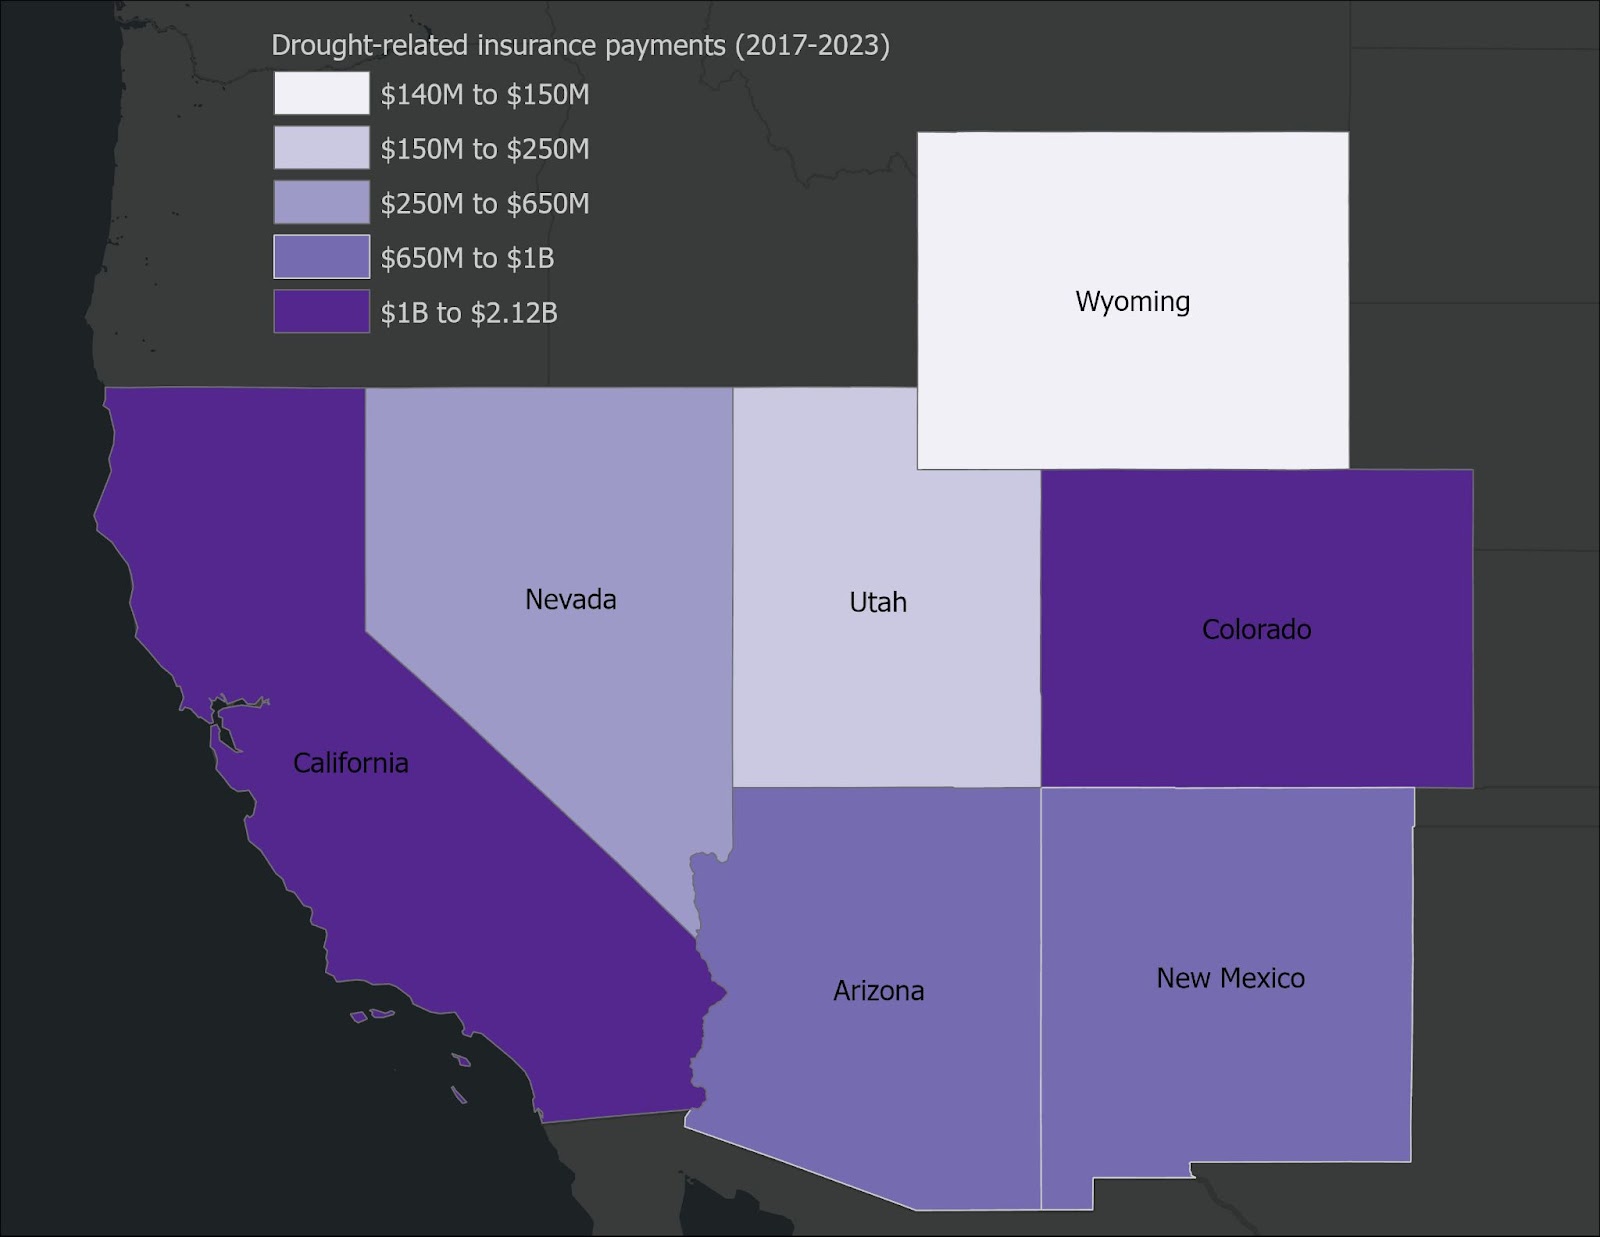
Source: EWG, from the USDA Risk Management Agency, Cause of Loss Historical Data Files
Drought-related payments accounted for a larger share of total insurance payments in the Colorado River Basin states than nationally. Across the U.S., half of total crop insurance payments were made because of the four drought-related payment triggers, but in the Colorado River Basin states, these triggers accounted for 61 percent of total indemnities.
The region also had a disproportionate increase in drought-related payments over the period EWG analyzed. Drought-related indemnities in the Colorado River Basin states went up 297 percent from 2017 through 2023, while national drought-related payments increased 253 percent. (See Figure 2 and Methodology, below, for more information.)
Figure 2. Drought-related indemnities in the Colorado River states increased over time.
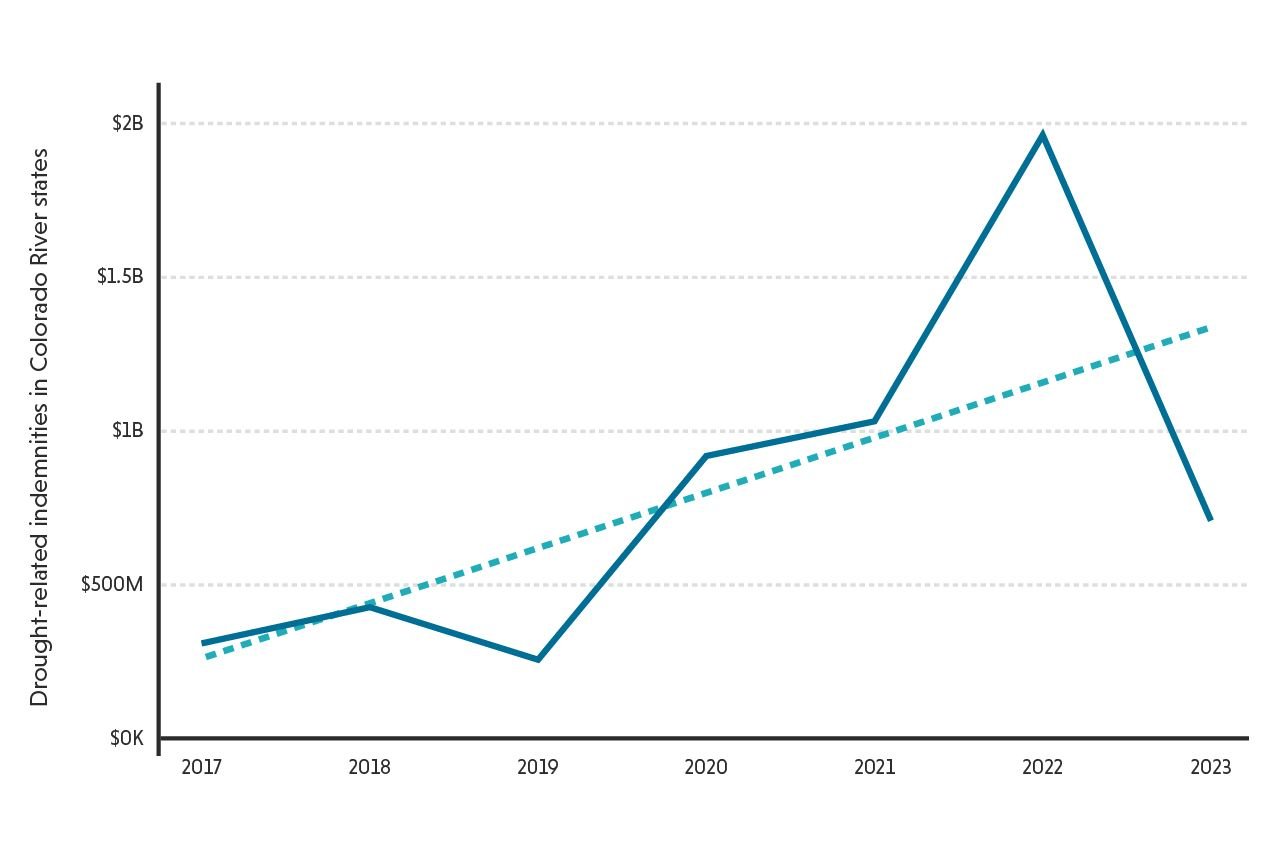
Source: EWG, from the USDA Risk Management Agency, Cause of Loss Historical Data Files
The Crop Insurance Program needs numerous updates to better incentivize farmers to adapt to drought and other extreme weather associated with the climate crisis.
Hundreds of millions of dollars for irrigation in drought-prone region
In the seven drought-prone Colorado River states, the USDA’s EQIP paid farmers $521.7 million in taxpayer dollars to install more efficient irrigation systems between 2017 and 2023. But any potential associated reduction in water use is undermined by water laws in the region.
EQIP does not allow farmers to use its funding to bring any new acres under irrigation, but it does subsidize the implementation of irrigation practices for crops that are already being irrigated. For example, EQIP pays farmers to switch from dirt irrigation ditches to plastic irrigation pipes.
But in many Western states, “use it or lose it” policies require water rights holders to use their total allotment of water for a “beneficial use” each year or risk losing rights to the water. This encourages farmers to use their entire water allotment to irrigate crops, even if their crops don’t need that amount of water, and even if there’s a drought.
Furthermore, evidence has shown that, even in areas of the country without use-it-or-lose-it policies, more efficient irrigation systems do not always lead to lower total water use.
EQIP provides funding to farmers to implement conservation practices on working farmland. The program includes conservation practices like cover crops and grassed waterways, as well as structural, equipment and facility practices like fencing and pipes.
Conservation dollars spent to update irrigation systems are funds that aren’t spent helping Western farmers adapt and become more resilient to climate change. At the same time, only a small portion of the USDA’s total conservation dollars funds climate-smart practices proven to help farmers reduce greenhouse gas emissions and adapt to climate change.
The USDA does not have a list of EQIP irrigation practices, so EWG determined which of the program’s practices are associated with irrigation. (See Methodology, below.) Our list includes practices like “irrigation pipeline,” “pumping plant” and “sprinkler irrigation systems,” which farmers use to irrigate farmland.
Just three practices made up 72 percent of all EQIP irrigation funding in these states. “Sprinkler irrigation system,” “irrigation pipeline” and “micro irrigation system” together accounted for $377.7 million paid to farmers in the states.
As with crop insurance, farmers in California and Colorado got the most EQIP irrigation payments in the region. (See Figure 4.)
Figure 4. Colorado River states and EQIP irrigation payments farmers received between 2017 and 2023.

Source: EWG, from public records requests for USDA-NRCS program data
Instead of heavily subsidizing irrigation practices in Colorado River region states, EQIP funding should focus more on paying farmers to switch to more drought-tolerant crops, to incorporate conservation crop rotations and to adopt other conservation practices that make their operations more resilient to climate change.
Meanwhile, it’s getting hotter and drier there
The Colorado River runs for 1,450 miles and supplies water to seven U.S. states. The river starts in Colorado in Rocky Mountain National Park – making the snowpack in the Rockies very important to water supply – and ends in Mexico. This region has always been arid, but it’s gotten more hot and dry in recent years.
The Fifth National Climate Assessment showed that the Southwest, which the federal government defines as Arizona, California, Colorado, Nevada, New Mexico and Utah, was “substantially warmer” between 1991 and 2020 than during the preceding 30-year period.
It also describes a “megadrought” in the region that has persisted since 2000 – “the driest 22-year period in 1,200 years.” The Colorado River’s total water flow has decreased about 20 percent compared to the average flow in the 1900s.
Warmer temperatures make drought worse. A recent U.S. Geological Survey study found that in the Upper Colorado River Basin, streamflow decreases 5 percent for every degree Fahrenheit temperature increase.
This trend is expected to continue. The climate assessment anticipates rising temperatures in the region and more frequent hot days.
Precipitation will also be more variable, and “snow drought” – when less snowpack in the mountains leads to less available water in the river downstream – will be more likely.
Reform is overdue
In the Colorado River Basin states, farmers are on a collision course with the climate crisis.
Agriculture’s ravenous water use can’t coexist with the area’s worsening drought. And shrinking water resources in the region go beyond the Colorado River: A recent study found that aquifers there are rapidly declining, too.
Farmers in the region must change what and how they farm. With help from agronomic experts and USDA farm programs, farmers in the region urgently need to evaluate the crops they grow and the agricultural practices they use, to adjust to hotter and drier conditions.
The Water Adaptation Techniques Atlas, created by a consortium of institutions, including the USDA, provides case studies of what people, organizations and farmers are already doing in some of the Western states to manage water scarcity issues.
The atlas includes over 60 case studies where farmers have altered their crop choices or rotations to better adapt to lower water availability. These case studies provide good examples of how federal farm programs can support farmers’ implementation.