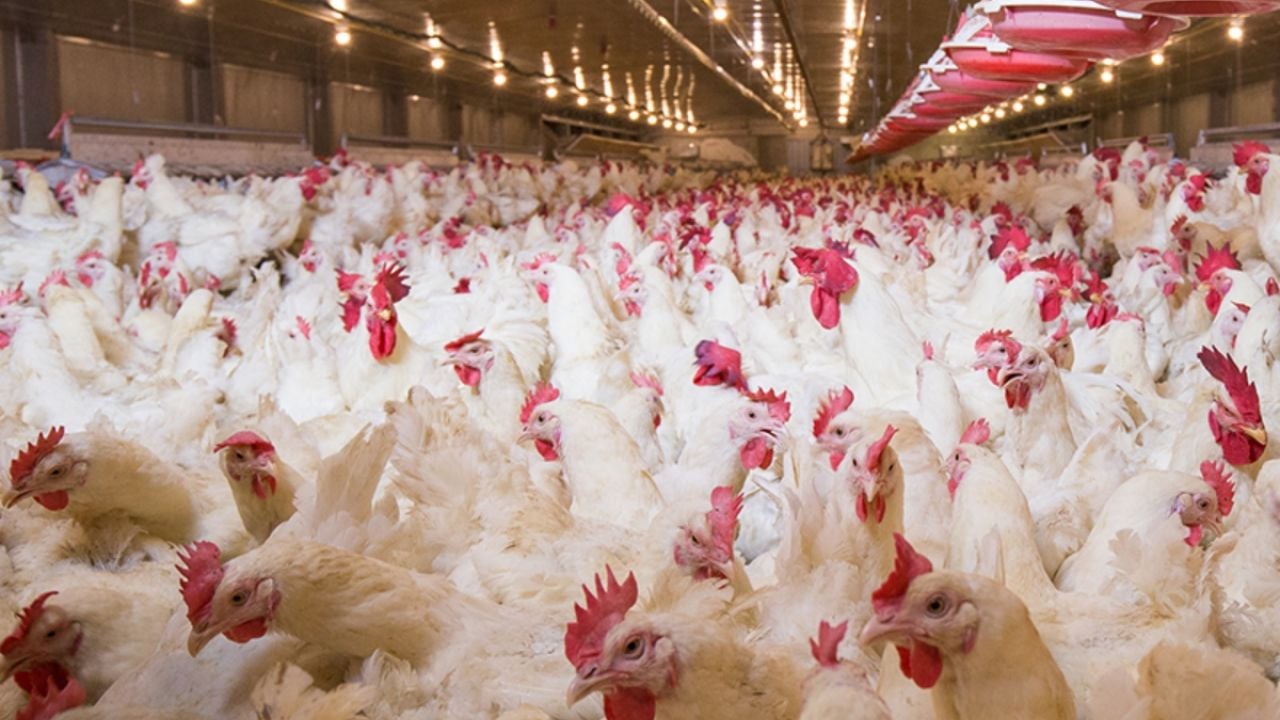
A new EWG investigation has used artificial intelligence to find poultry farms in North Carolina housed almost 357 million chickens and turkeys as of 2022 – about 33 birds for every human.
That’s a 43 percent increase since 2007, when there were about 250 million birds.
EWG examined aerial imagery from the Department of Agriculture with machine learning, a type of AI, to identify active poultry operations and determine the number of birds they likely had or have. This method is more accurate than those used in past studies.
The findings provide up-to-date and accurate data about poultry factory farms, crucial because North Carolina’s agencies don’t track their location or size. And the state does very little to regulate how they’re run or where their copious amounts of manure end up.
People who live near factory farms risk getting sick from drinking contaminated water and developing asthma and other respiratory problems from breathing polluted air.
Other dangerous phenomena that can be attributed at least in part to poultry operations include antibiotic-resistant bacteria, toxic algae blooms and global pandemics such as bird flu.
North Carolina’s lawmakers and agencies must implement strong regulations on poultry concentrated animal feeding operations, or CAFOs, and protect residents from their many harms.
Five counties represent bulk of booming poultry industry
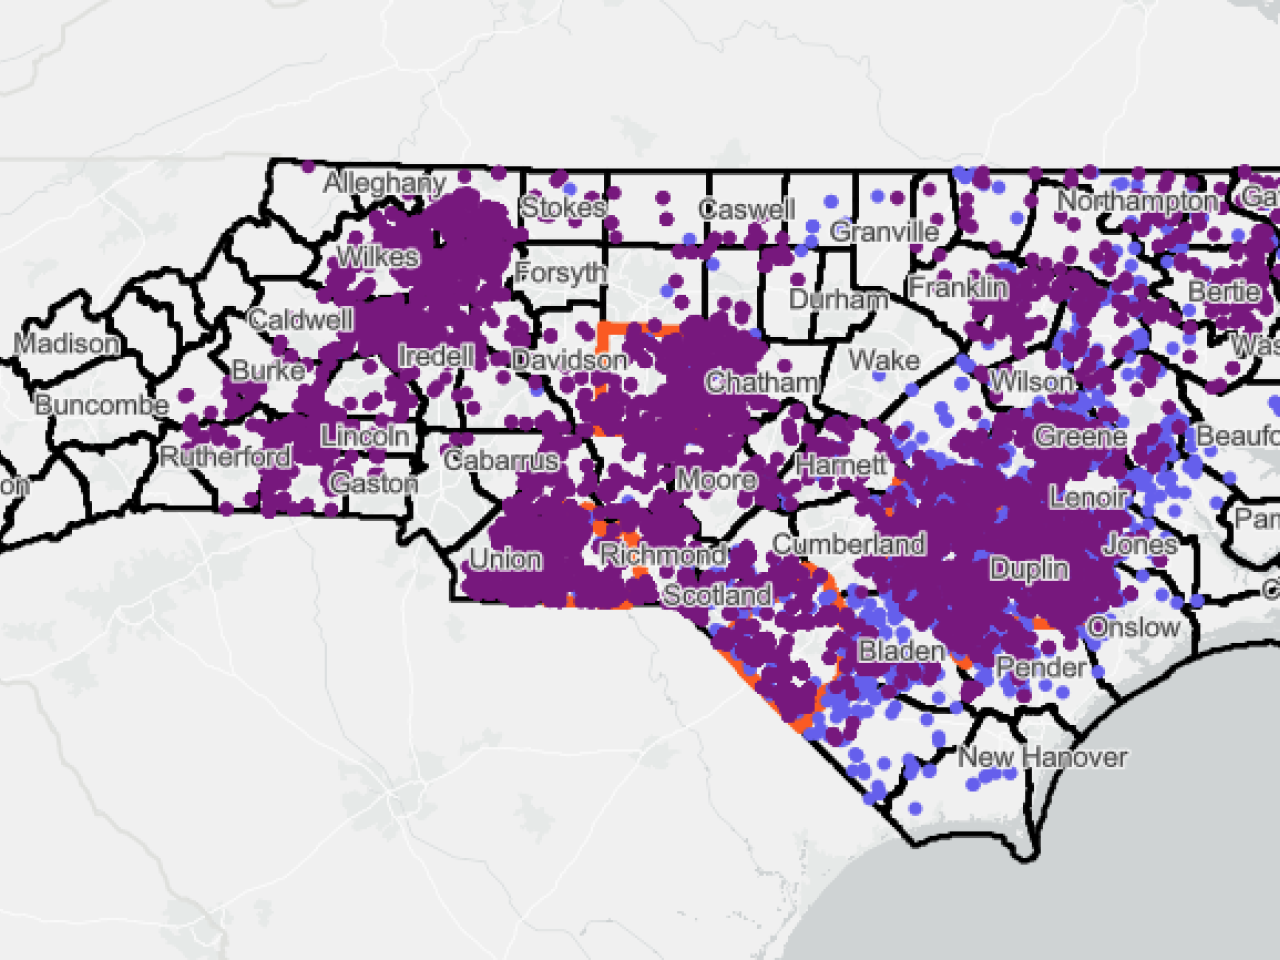
Across North Carolina’s 100 counties, the five with the most poultry are Duplin, Sampson, Robeson, Anson and Randolph. Together, they account for more than 35 percent of the state’s birds.
The map below shows where poultry was most concentrated in the state in 2022.
Almost 357 million chickens and turkeys and 9.6 million hogs were housed on factory farms in North Carolina in 2022.
Duplin and Sampson counties alone have almost one-fifth – 19 percent – of all the poultry.
Table 1. Top North Carolina poultry counties in 2022.
County | Total poultry barns | Total poultry | Percent of total poultry in N.C. | Amount of manure generated per year (in tons) |
Duplin | 1,555 | 36,542,978 | 10% | 323,720 |
Sampson | 1,502 | 30,257,144 | 9% | 280,165 |
Robeson | 834 | 25,141,894 | 7% | 183,927 |
Anson | 805 | 17,582,749 | 5% | 152,397 |
Randolph | 699 | 15,865,431 | 4% | 138,208 |
Source: EWG and 2022 USDA Census of Agriculture.
EWG identified a 43 percent increase in the state’s poultry population between 2007 and 2022 – from 249,795,021 birds to 356,808,908.
But the increase in poultry was not evenly distributed across North Carolina – far from it. In four of the top five poultry counties, the rate of growth was much steeper than in the rest of the state.
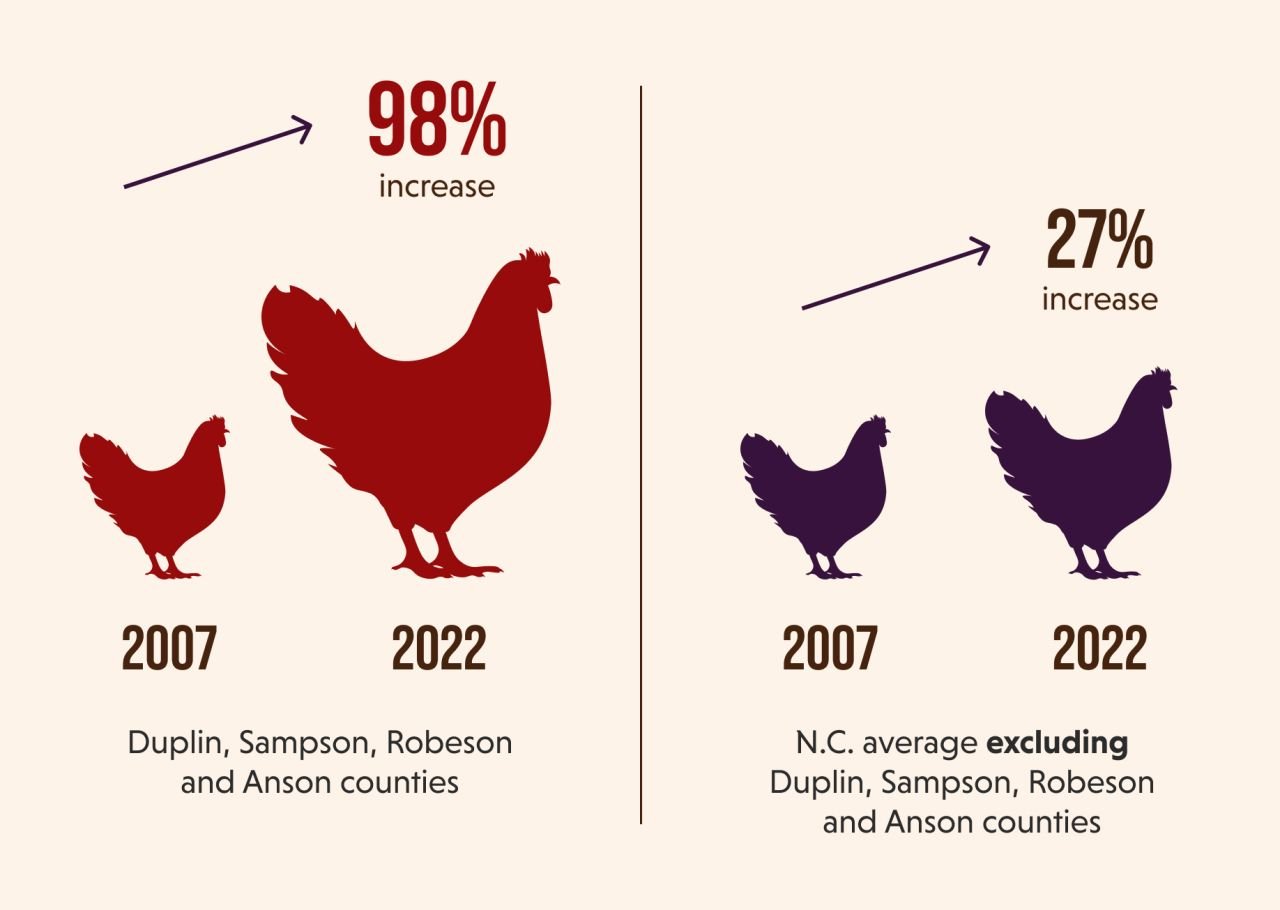
Looking at only Duplin, Sampson, Robeson and Anson counties, the average growth between 2007 and 2022 was 98 percent.
And when EWG calculated the state’s average growth excluding those four counties, it dropped from 43 percent to 27 percent.
In total, more than half – 50.6 percent – of all new poultry in the state over the 16-year period analyzed appeared in those four counties alone.
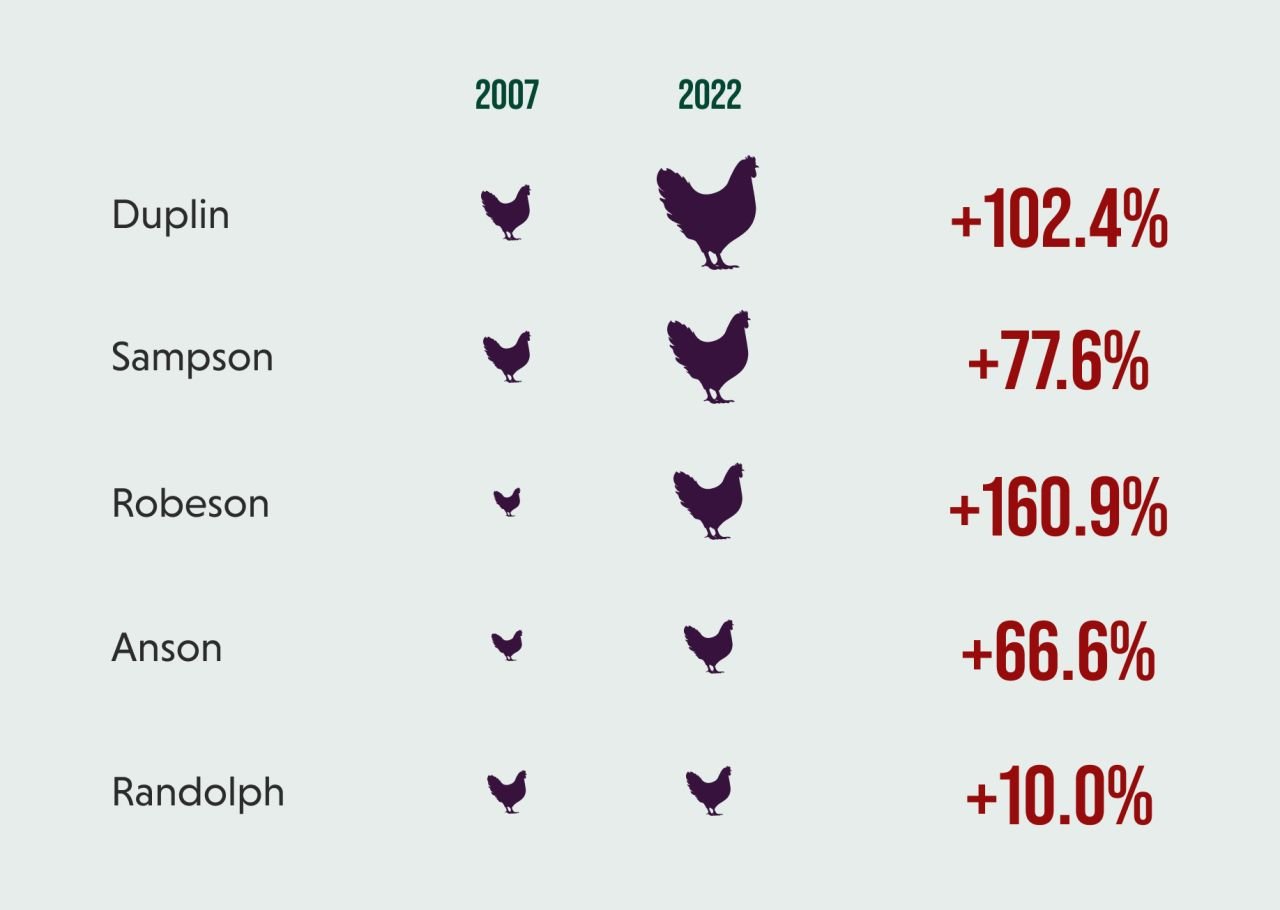
In the fifth county, Randolph, poultry grew by just 10 percent. Notably, Randolph’s population is 75 percent white – by far the highest proportion of white people of the top five poultry counties, the 2020 U.S. Census shows.
In North Carolina, the disastrous effects of large CAFOs are more likely to harm communities of color, as a 2020 EWG investigation spotlighted. (Many other studies have also described this troubling and unjust trend.)
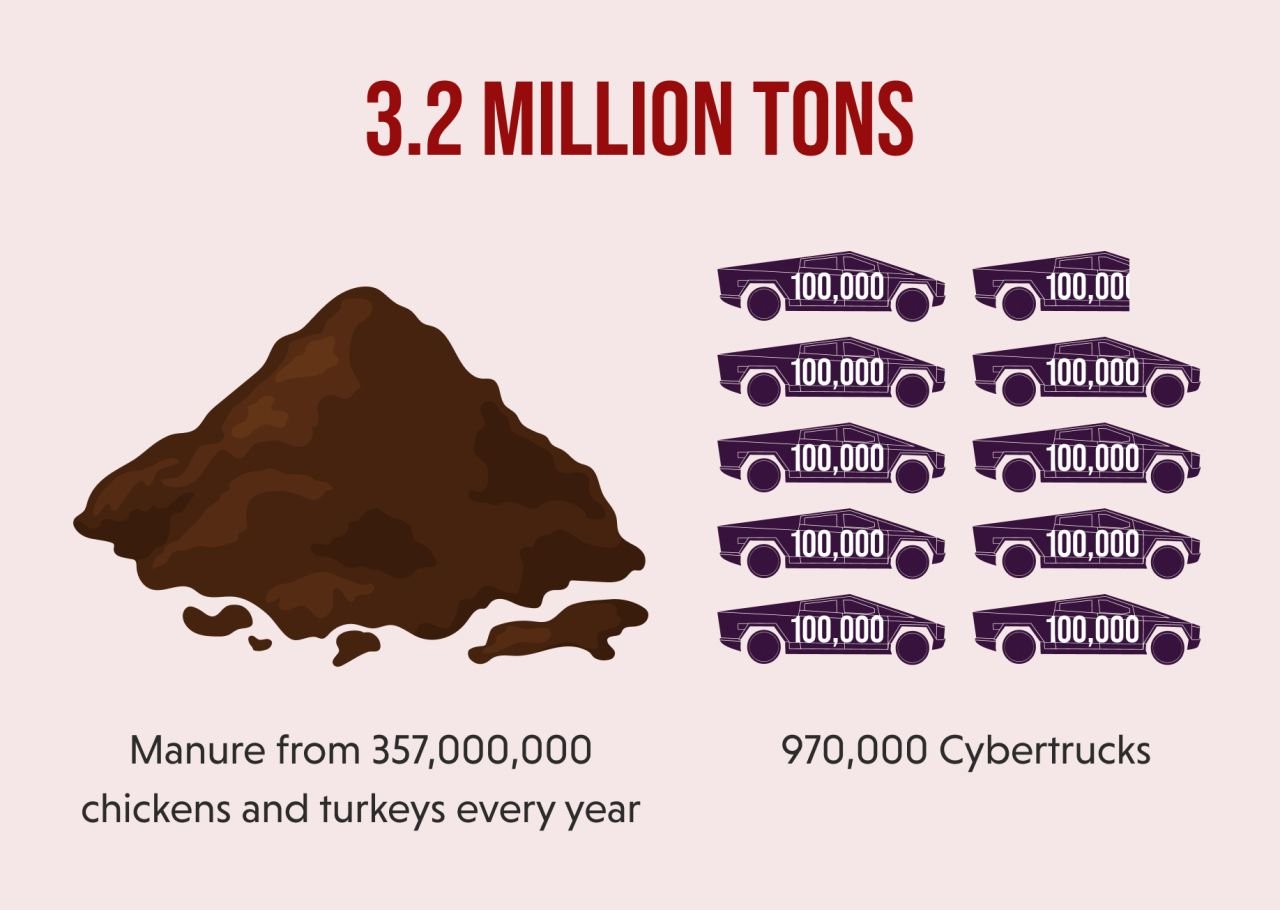
Over 3.2 million tons of fowl waste fouls the state
According to EWG’s calculations, North Carolina’s 357 million chickens and turkeys produce over 3.2 million tons of manure in 2022. That’s about the weight of almost 970,000 Tesla Cybertrucks.
Poultry manure is loaded with chemicals like nitrogen, phosphorus and ammonia. It also carries dangerous pathogens like giardia, E. coli, salmonella and cryptosporidium.
Poultry manure is typically managed as “dry” waste, euphemistically called “litter.” The animals’ feces are gathered into open-air, putrid heaps together with bird carcasses, feathers and bedding. These mounds can be enormous.
North Carolina regulations allow the waste to be stored in uncovered piles for up to 15 days at a time – though authorities rarely enforce even this limit as the advocacy group Waterkeeper Alliance has repeatedly documented.
This manure and other material is applied, untreated, to crop fields as fertilizer, in many cases just to dispose of it, regardless of whether plants need it. And no one tracks where it’s spread – let alone how much is applied in any given area.
Poultry factory farms pollute water – including wells
The enormous amounts of manure created by North Carolina’s poultry factory farms threaten water quality across the state, particularly in areas where operations are most concentrated.
A 2022 EWG investigation spotlighted the risk of flooding faced by poultry and swine CAFOs in North Carolina, finding that 156 were located in or just outside of floodplains – and that many more facilities were likely also at a high risk of flooding. Thanks to the climate crisis, extreme catastrophes like flooding are becoming more common in many places.
Even without such events, the dangers that CAFOs pose to humans and the environment are ever-present.
Manure that washes or blows off farm fields or CAFOs can pollute waterways, harming wildlife, feeding toxic algae blooms and contaminating rivers used to supply drinking water to utilities.
It can also taint private wells, causing severe gastrointestinal issues and even death for people who consume that water.
About 2.4 million North Carolinians, or more than one in five residents – more than almost any other state – rely on private wells for their drinking water, according to the state Department of Health and Human Services. Many wells are rarely or never tested, let alone treated, for contaminants.
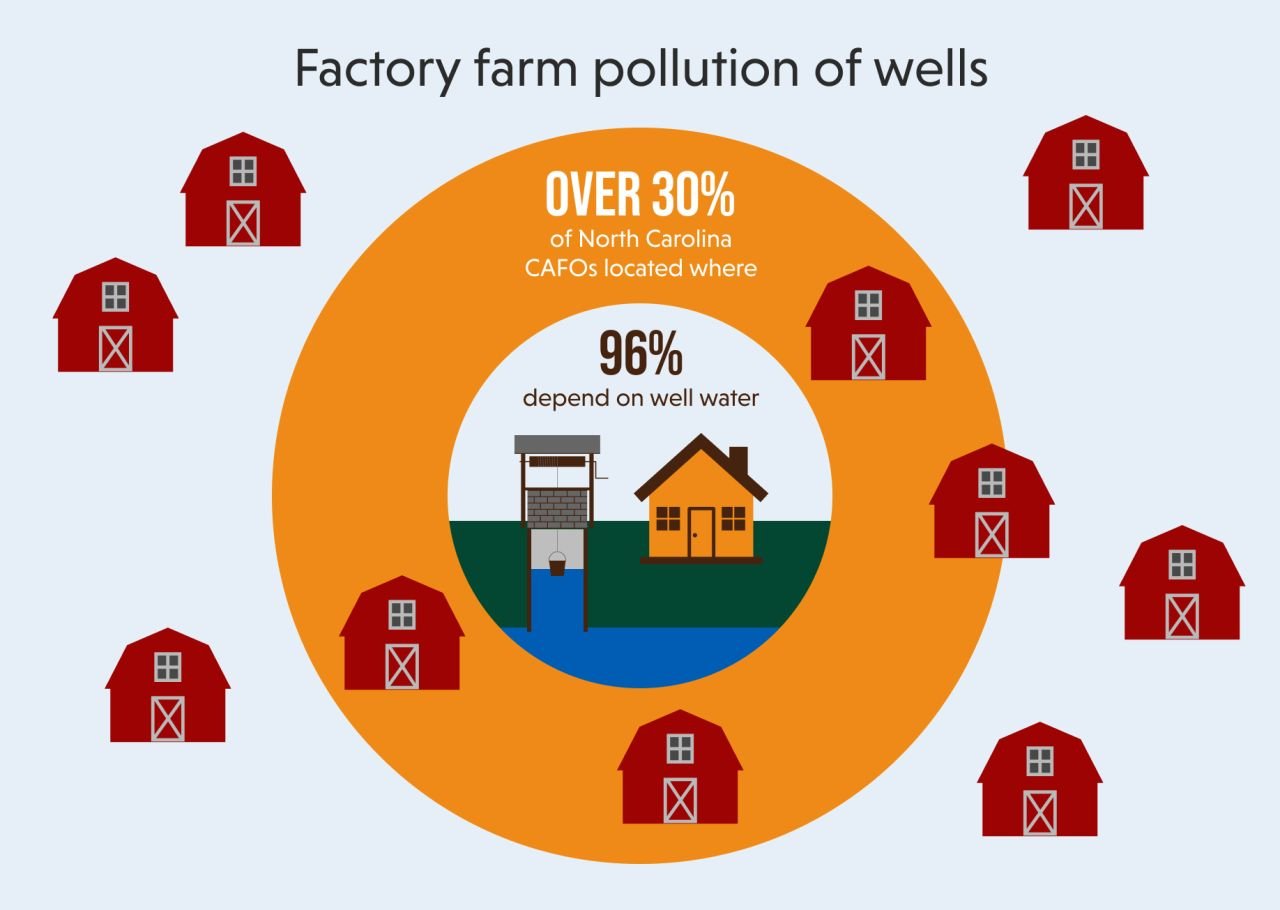
One 2016 Duke University study found that more than 30 percent of CAFOs in the state can be found in areas where over 96 percent of residents depend on well water.
After Hurricane Florence hit the state, in 2018, in many places dumping over 30 inches of rain over two days, tests of private wells uncovered huge spikes in E. coli and other coliform bacteria, which are often used as an indicator of the presence of dangerous pathogens.
As climate change accelerates and severe storms become both more frequent and more intense, contaminated runoff from poultry and other CAFOs will almost certainly worsen, endangering the drinking water supply for many rural communities.
Poultry factory farms pollute air – and schools are at risk
North Carolinians are also at risk from the severe air pollution that the state’s booming poultry factory farms produce.
These facilities emit air pollution like hydrogen sulfide, ammonia and particulate matter that can cause serious health problems, such as respiratory issues and infectious diseases in workers and people living nearby.
One study found that, in just one year, two chicken houses in Kentucky emitted more than 10 tons of ammonia, a potent greenhouse gas that can cause lung damage.
Research published in 2019 determined that pollutants from CAFOs, including poultry, can cause respiratory damage in residents up to 4 miles away.
EWG’s analysis found that 32 percent, or almost one-third, of North Carolina’s public schools – 899 out of 2,773 – are within 4 miles of a poultry barn.
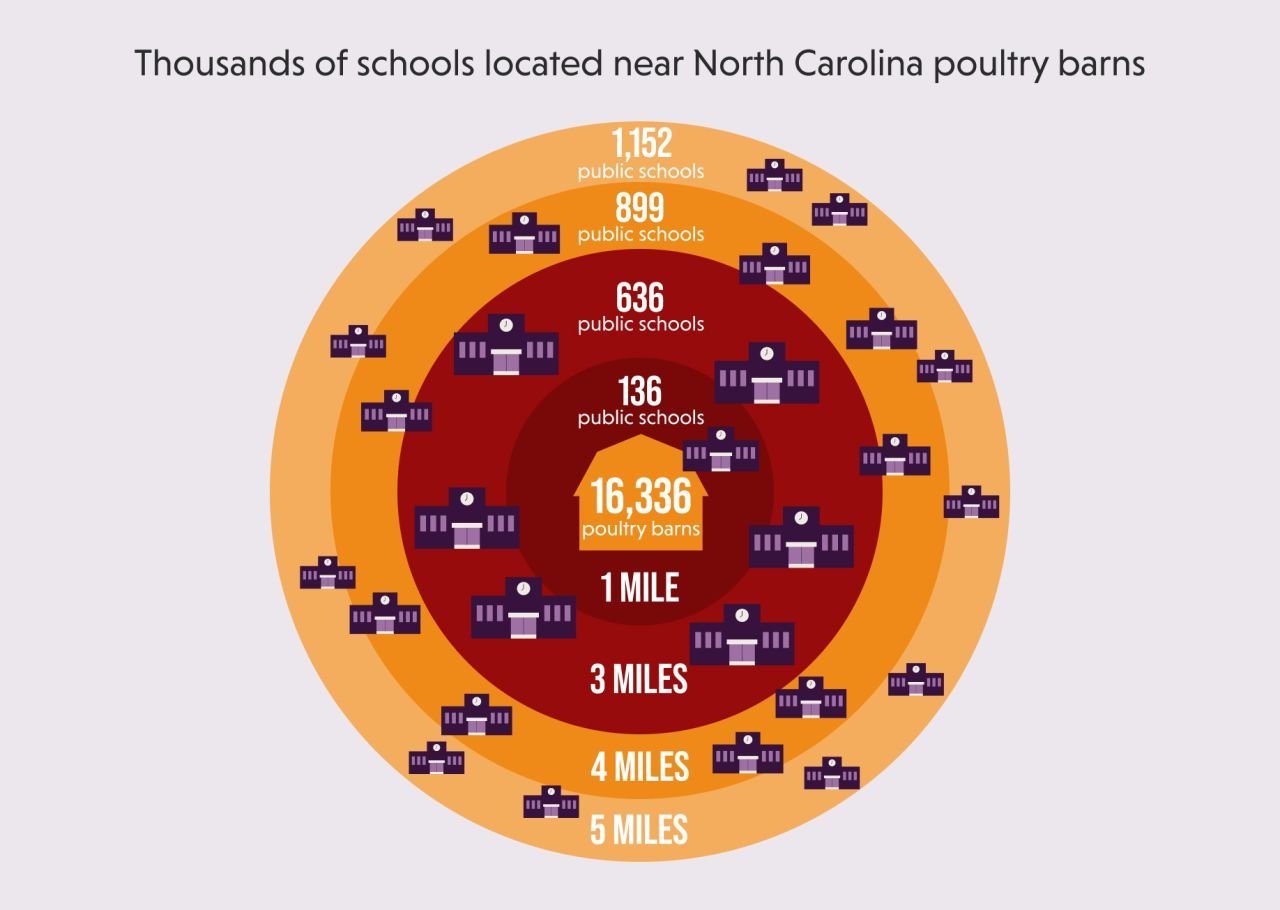
All together, over 64 percent of the state’s poultry barns – 10,535 barns with nearly 227 million birds – are within 4 miles of a public school.
Poultry and other livestock facilities also contribute to the dangerous and rapidly spreading antibiotic-resistance crisis that increasingly makes it harder to treat common ailments like tuberculosis, pneumonia, urinary tract infections and sexually transmitted diseases.
According to the Centers for Disease Control and Prevention, more than 2.8 million antibiotic-resistant infections occur in the U.S. each year, killing over 35,000 people.
Risks rise when people live close to both poultry and swine facilities
The health of North Carolina’s residents is particularly under threat in areas where expanding poultry operations are located near swine CAFOs.
Numerous studies have documented the way swine and cattle factory farms can devastate the health of people who live nearby, including with an increased risk of dying from cardiovascular problems, a higher incidence of asthma and other respiratory issues and an elevated possibility of exposure to antibiotic-resistant bacteria.
A 2018 study found that North Carolina communities located near hog CAFOs had more deaths due to anemia, kidney disease, tuberculosis and septicemia, as well as increased infant mortality, among many other concerning findings.
And in North Carolina, the dangers of living near swine operations are disproportionately borne by Black, Native American and Latino people.
Because many poultry operations are sited near swine facilities, it’s likely these same communities also bear an outsize burden of the harms caused by poultry CAFOs.
EWG compared state data about swine operations to our poultry map. We found that the three counties with the most poultry are also home to almost half of North Carolina’s swine – about 4.68 million pigs out of the state’s total of almost 9.6 million. (The state tracks the location of facilities for swine but not poultry.)
Table 2. Millions of poultry and swine in North Carolina.
County | Total poultry | Percent of total N.C. poultry | Rank (most poultry to least) | Total swine | Percent of total N.C. swine | Rank (most swine to least) |
Duplin | 36,542,978 | 10% | 1 | 2,247,145 | 23.5% | 1 |
Sampson | 30,257,144 | 9% | 2 | 2,124,627 | 22.2% | 2 |
Robeson | 25,141,894 | 7% | 3 | 310,337 | 3.2% | 6 |
Anson | 17,582,749 | 5% | 4 | 44,414 | 0.5% | 26 |
Randolph | 15,865,431 | 4% | 5 | 40,414 | 0.4% | 29 |
Source: EWG, 2022 USDA Census of Agriculture and 2022 N.C. Department of Environmental Quality swine data.
And long before Covid-19, scientists had raised the specter of pandemic risk from swine and poultry operations located near each other, as experts did at a 2004 conference at the University of Iowa School of Public Health.
North Carolina must regulate its poultry industry
Poultry operations are almost completely free of state oversight, so they’re also exempt from public protections like odor ordinances and zoning regulations. Factory farm operators need little more than a building permit to open poultry CAFOs housing up to 50,000 chickens or turkeys.
The North Carolina General Assembly has also passed many “right to farm” laws to limit operators’ accountability to their neighbors and the communities where they operate.
And federal laws don’t make up for the state’s failure to protect its residents.
The Environmental Protection Agency doesn’t monitor air quality near CAFOs – including those raising poultry. And poultry operations (and most other CAFOs) are largely exempt from federal water pollution regulations, including the 50-year-old Clean Water Act.
In 2022, EWG joined a coalition of over 50 citizens’ groups and environmental and community advocacy organizations that petitioned the EPA to improve its oversight of water pollution from CAFOs.
In its 2023 response, the EPA agreed that industrial animal facilities cause water pollution. The agency also acknowledged that increased oversight is needed to better protect communities and waterways. But it declined to take immediate action. Instead, the EPA created a committee filled with farmers, asking it to submit comments after reviewing the issue. That committee, which held its first meeting in 2024, has yet to issue a report or recommendation.
To protect the health of its residents – particularly those in places with the highest concentrations of factory farms – North Carolina must address the serious public health and environmental problems that poultry and other CAFOs cause.