Overview
- Research shows adults take in up to 150,000 plastic particles annually via their diet.
- EWG estimates that’s equivalent to consuming up to 12 plastic shopping bags per year.
- Lifestyle and dietary changes can help reduce your exposure to these particles.
Next time you buy groceries, look at your shopping bag and imagine eating up to 12 a year – that’s how much invisible plastic pollution EWG estimates an adult could be consuming.
This report details EWG’s review of the science about plastic particles, exposure sources and the amount the average person might consume every year. Nobody wants to snack on the equivalent of a plastic shopping bag every month indefinitely, but that’s EWG’s conservative estimate of how much plastic adults can absorb through current exposures.
Every day, people unknowingly swallow tiny pieces of plastic, often referred to as nanoplastics or microplastics. Scientists think exposure to these substances can threaten human health, with studies linking it to a greater risk of stroke or heart attack. They continue to assess other potential dangers of these small particles’ build-up in the body. But for many types of plastic, there is scant – or sometimes zero – research on their harms.
Researchers are starting to discover a diversity of these particles in our bodies, including in tissue samples and placentas. Once there, they can cause health problems, which include inflammation, uncontrolled cell growth, disruption of the immune system and other problematic outcomes.
And these particles are tiny. The naked eye can almost never see individual particles, whether they’re nano, micro or macro sized. It’s helpful to use an analogy to conceptualize the scale of these particles – a nanoplastic particle is to a baseball what a baseball is to the entire Earth.
Some sources of exposure to plastic pollution are well known, including microwaving plastic food storage containers and drinking from plastic water bottles left out in the sun.
And recent research shows these tiny particles are much more prevalent than initially believed. They’ve been found in staggering concentrations in food, condiments, drinking water and kitchenware.
EWG’s analysis shows that plastic cutting boards are a key culprit. But a person could take in plastic particles through their food and beverages in countless other ways.
Long-term policy changes that discourage plastic use can help. In the short-term, steps like lifestyle adjustments may help reduce your exposure and risk.
How plastics penetrate food, water and bodies
Plastic is everywhere.
Polyethylene, polypropylene, polystyrene and polyvinyl chloride, better known as PVC, are just some of the many types of plastics used in a wide range of consumer and industrial applications, from textile production to the manufacturing of cosmetics and household cleaning supplies.
The Environmental Protection Agency estimates that over 14.5 million tons – roughly 40 Empire State Buildings – of plastic were used in containers and packaging alone in 2018. In a typical grocery store, plastic touches almost everything in sight, including shopping bags, food packaging and beverage containers.
As plastics break down over time, they fragment into much smaller particles, like microplastics and nanoplastics. These ultramicroscopic particles, often over a thousand times smaller than the width of a single human hair, can enter food or beverages at any stage before they’re consumed.
Crops often grow in soil and water contaminated with micro and nanoplastics. Seafood is continuously exposed to floating plastic particles that can both bioaccumulate and cling to it.
Plastic packaging is another prominent source, continuously exposing foods to tiny particles during transport and storage, and as they sit on kitchen shelves for days. Even after foods are removed from packaging, they can be exposed to a vast amount of plastic.
A 2023 study found that chopping produce on polyethylene or polypropylene cutting boards can lead to massive amounts of mineralized plastics sticking to foods. Microwaving, or even just storing, foods in plastic food storage containers or cups can release microplastics and nanoplastics into the foods we consume.
Drinking water from plastic bottles is also a major source of exposure to these miniscule particles. Typically these are fragments of polyethylene terephthalate, released when bottles are squeezed at their necks, exposed to the sun, or naturally degrade over time.
Even the drinking water from your home’s faucet might be problematic, because PVC water pipes are known to be a source of plastic exposure, albeit far less than plastic bottles.
Eating a plastic bag every month for a year
Scientists are finding new ways in which people are exposed to plastic particles and are increasingly raising concerns about how harmful they can be when ingested. The missing link at the center of EWG’s analysis is an estimate of just how much plastic we unwittingly consume in a year.
Several studies have assessed the number of particles ingested from various foods and beverages. They usually suggest a typical person swallows hundreds of thousands of microplastic particles annually. However, only a handful of papers have expressed their estimate as a range of the mass of particles consumed – that is, how many grams of plastic end up in bodies via food and drink.
Because plastic particles come in all shapes and sizes, calculating the amount taken in every year requires some assumptions and mathematical estimates. For this analysis, EWG erred on the side of caution.
EWG focused exclusively on studies published since 2020, which offer more precision in detecting plastics, thanks to technological advancements. And we limited our review to studies that included both a lower and upper estimate of annual plastic consumption – whether that was expressed directly as total grams or indirectly as the number of microplastic particles.
Our methodology dives into the finer details of the math involved with our estimates, but in broad terms we calculated microplastic density in cubic centimeters for polyethylene, polypropylene and polystyrene, then combined this value with the average volume of a plastic particle, and this produced our estimate of how many grams of plastic a person may ingest in a year (see Table 1).
Based on a review of existing studies, EWG estimates a typical person in one year consumes between:
- 0.06 and 0.10 grams of plastic from drinking water.
- 10.87 and 20.88 grams of plastic from food.
- 7.40 and 50.71 grams of plastic from cups, boards and containers.
Combined, this means an average person takes in anywhere from 18.33 to 71.69 grams per year of plastic particles. But how do we convert that to the equivalent of eating plastic bags?
Table 1: Estimates of annual plastic mass consumption by category
Category | Exposure route | Literature reference | Reported type of plastic exposure | Lower estimate (grams/person/year) | Upper estimate (grams/person/year) | Notes |
Water | Drinking water | Senathirajah et al. (2021) | Direct mass | 0.06 | 0.10 | Predominantly nanoplastics (mass is very small) Predominantly bottled water |
Food | Dietary: Beverages, honey, meat, seafood, vegetables | Bai et al. (2022) | Microplastic total | 0.070 | 0.076 | Predominantly nanoplastics (mass is very small) Predominantly bottled water Diameter = 100 µm |
Salt | Senathirajah et al. (2021) | Direct mass | 10.8 | 20.8 | ||
Plasticware | Cutting boards | Yadav et al. (2023) | Direct mass | 7.4 | 50.7 | Assuming polyethylene (vast majority) |
Plastic cups | Zhou et al. (2022) | Microplastic total | 0.0023 | 0.0055 | Predominantly nanoplastics (mass is very very small) Diameter = 50 µm | |
Takeout containers | Du et al. (2020) | Microplastic total | 0.0003 | 0.0052 | Predominantly nanoplastics (mass is very very small) Diameter = 100 µm | |
Total | 18.33 | 71.69 | ||||
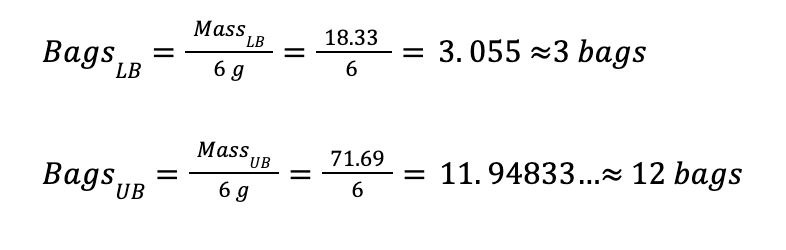
A typical grocery bag, 12 by 7 by 22 inches when unfolded, weighs around 6 grams when it’s empty.
Using these values, EWG estimates that, at the upper end of potential exposures, an adult could be taking in the equivalent of about 12 grocery bags worth of plastic particles a year through water, food and plasticware. At the lower end, it’s three bags.
That’s a conservative take on the largest equivalent amount of bags someone could consume a year. No two people eat or drink in exactly the same way. Diet varies significantly across cultures, household income levels, ages and season, to name just a few factors. For many people, the number could be lower; for others, it could be representative of their current practices.
Limits of EWG’s findings
Many studies highlight seafood as a significant source of microplastic contamination and include mollusks and other shellfish in plastic particle estimates. But vegetarians, those with allergies, and those who don’t like seafood aren’t exposed as much as, say, oyster fans.
The same variation is true when it comes to plasticware. In some households, a person might use a plastic cup daily, whereas in others they might never use them, or use them only rarely.
EWG noted these limitations in the analysis, and we emphasize the uncertainty in the range of many current estimates of dietary plastic exposures.
So three bags at the lower end or 12 bags at the upper end applies to those exposed least and most to plastic particles each year – not necessarily to the “average adult.” For further details on our methodology and its limitations, see the report’s methodology.
Reducing your plastic exposures
Whether someone is unwittingly consuming the equivalent of three plastic shopping bags per year or 12, the problem remains – people ingest too many plastic particles.
Plastic pollution is systemic. Big companies often fight campaigns urging them to reduce their use of plastic – though they’re among the largest contributors to oceanic plastic contamination.
Food processing has been shown to exponentially increase dietary plastic exposure. But consumers are largely left to fend for themselves when it comes to finding ways to reduce their intake.
With all these different exposure routes, the best way to achieve long-lasting change is for states and the federal government to advance policies that encourage efficient plastic recycling, target the excessive dumping of plastic waste in landfills and oceans, and, crucially, promote health and safety by minimizing industrial plastic use altogether.
Unless and until such policies are achieved, here are steps you can take to lower your exposure to plastic particles – and cut down on how many shopping bag equivalents end up in your day-to-day diet. It’s impossible to completely avoid plastics because of how much they’re used, but you might want to consider:
- Switching to wood cutting boards. EWG’s analysis showed that plastic cutting boards are a leading source of exposure based on how someone eats. Polyethylene cutting boards alone made up 70 percent of the overall annual plastic ingestion estimate. Substituting plastic cutting boards for alternatives that don’t increase plastic exposure (such as wood cutting boards) can be a simple and fairly affordable option.
- Changing bottled water drinking practices. There are many financial, seasonal and other factors that can affect whether or not you can reduce drinking from plastic bottles. But no matter your situation, you can cut the amount of plastic you’re exposed to by not drinking from bottles that are heavily squeezed or left in the sun.
- Avoiding use of plastic reusable containers as much as possible. To store takeout or produce, we recommend glass containers whenever possible to prevent contamination from plastic degradation. More importantly, try to use glass containers when microwaving foods to avoid speeding up break-down contamination.
- Advocating for less use of plastic. Moving away from plastics is the best all-around approach to reducing exposures and health harms. Consider backing calls for bans on single uses of plastics and supporting plans to regulate microplastic contamination – including international efforts to tackle the problem.