Almost all of the more than 1,000 large animal feeding operations in California are very close to water sources that are used to irrigate crops, threatening the food supply for the entire country, a new EWG analysis finds.
Contaminants commonly found in animal manure, like E. coli and salmonella, can enter these bodies of water, and the water may then be sprayed on food crops such as leafy greens, potentially creating foodborne illness outbreaks.
What happens on farm fields in the state can affect people across the U.S., since farmers in California grow more than one-third of the nation’s vegetables and three-fourths of fruits.
To protect public health, the Food and Drug Administration must require farmers who use potentially contaminated irrigation water on their produce to test for these contaminants.
The Environmental Protection Agency must also more rigorously oversee the large amount of manure produced by concentrated animal feeding operations, or CAFOs.
Almost all of California’s CAFOs close to irrigation canals
EWG experts used state data to geolocate 1,062 CAFOs in California. Of those, almost 93 percent were within 1 mile and 42 percent were within a quarter of a mile of waterways often used for irrigation.
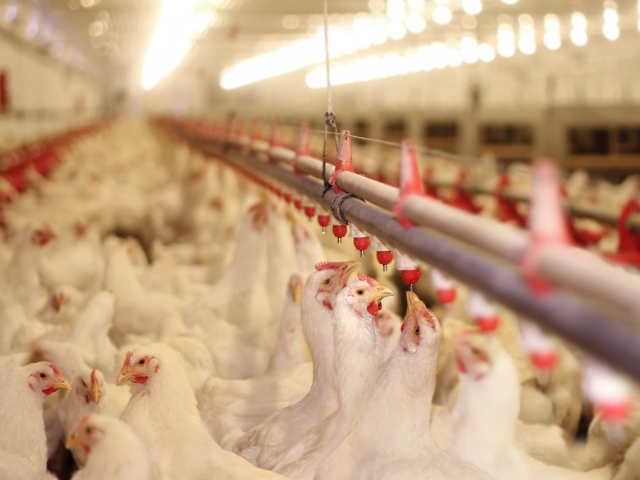
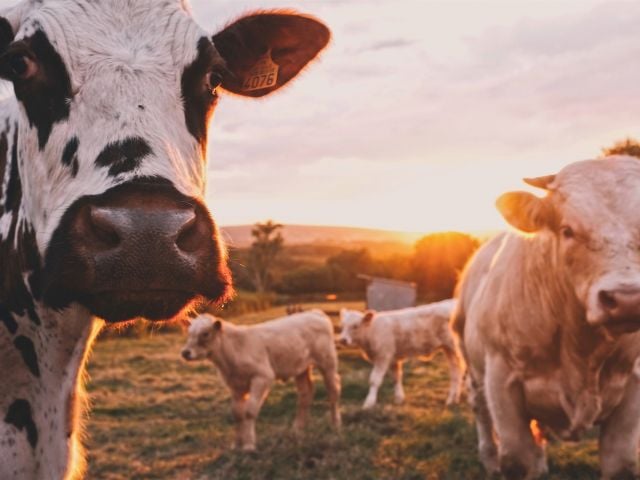
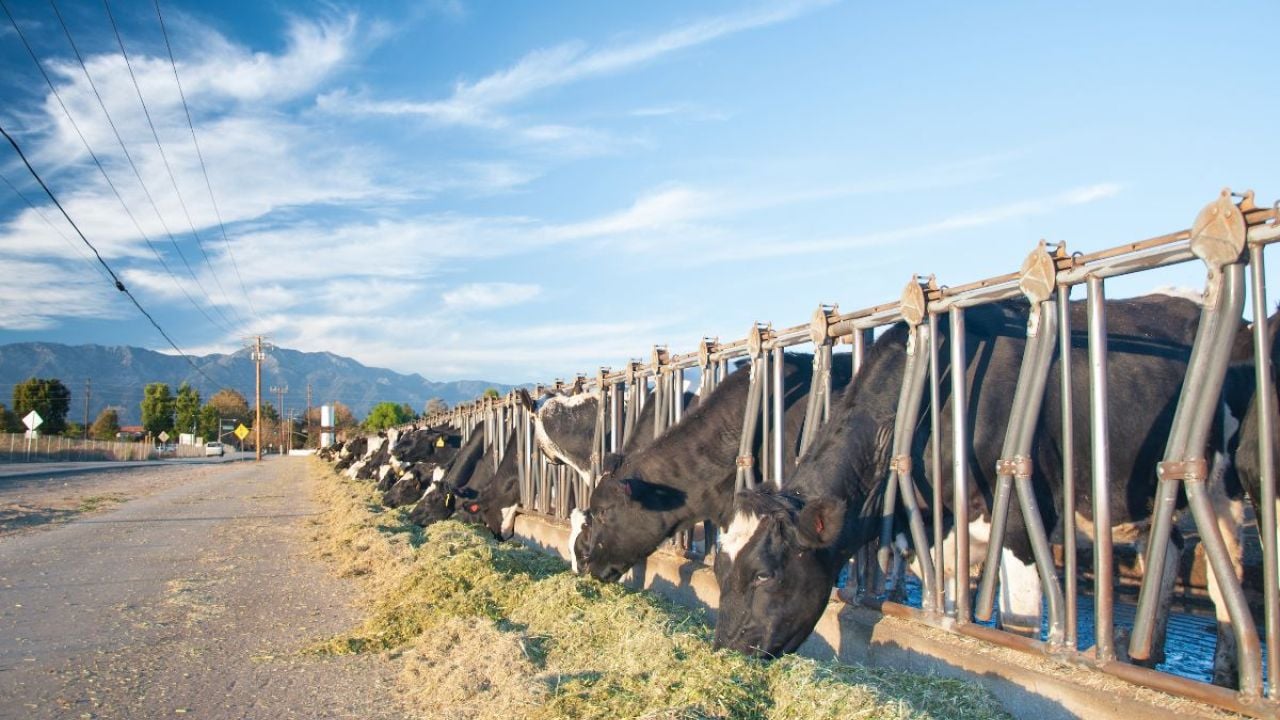
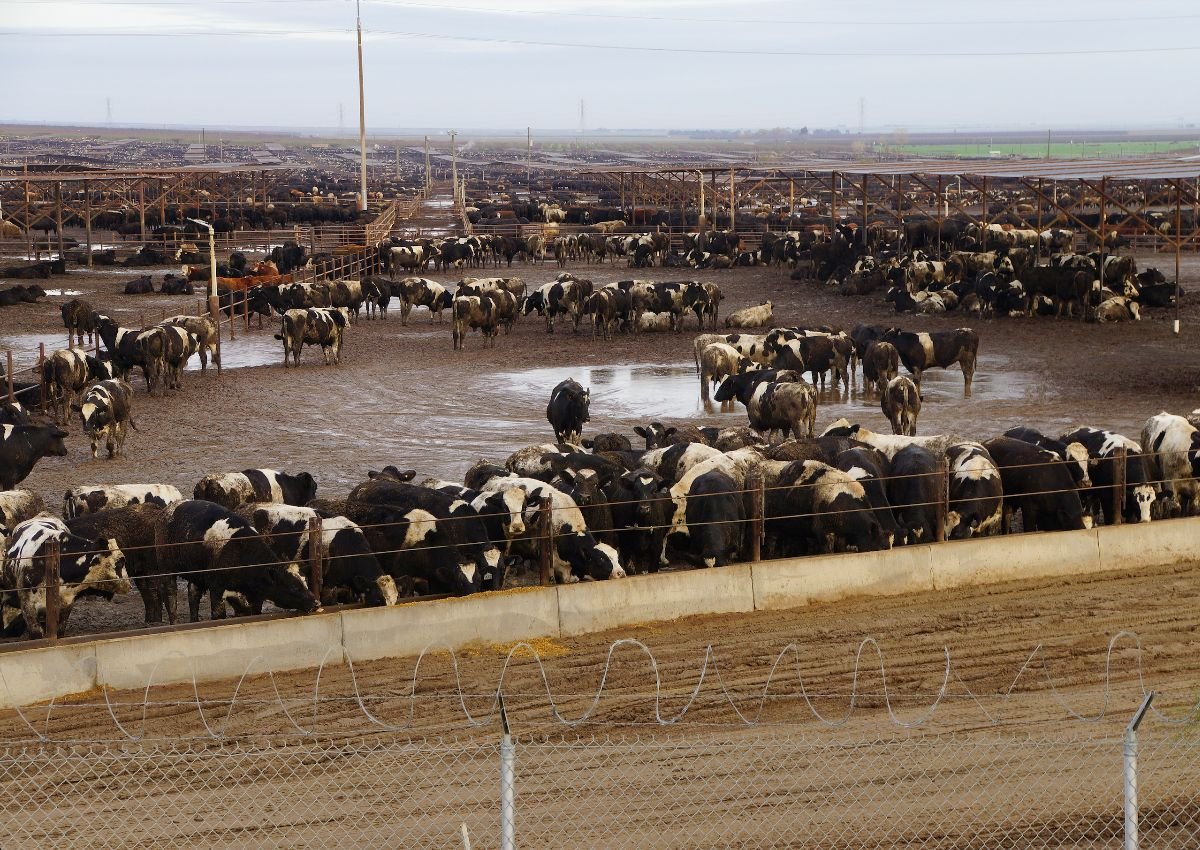
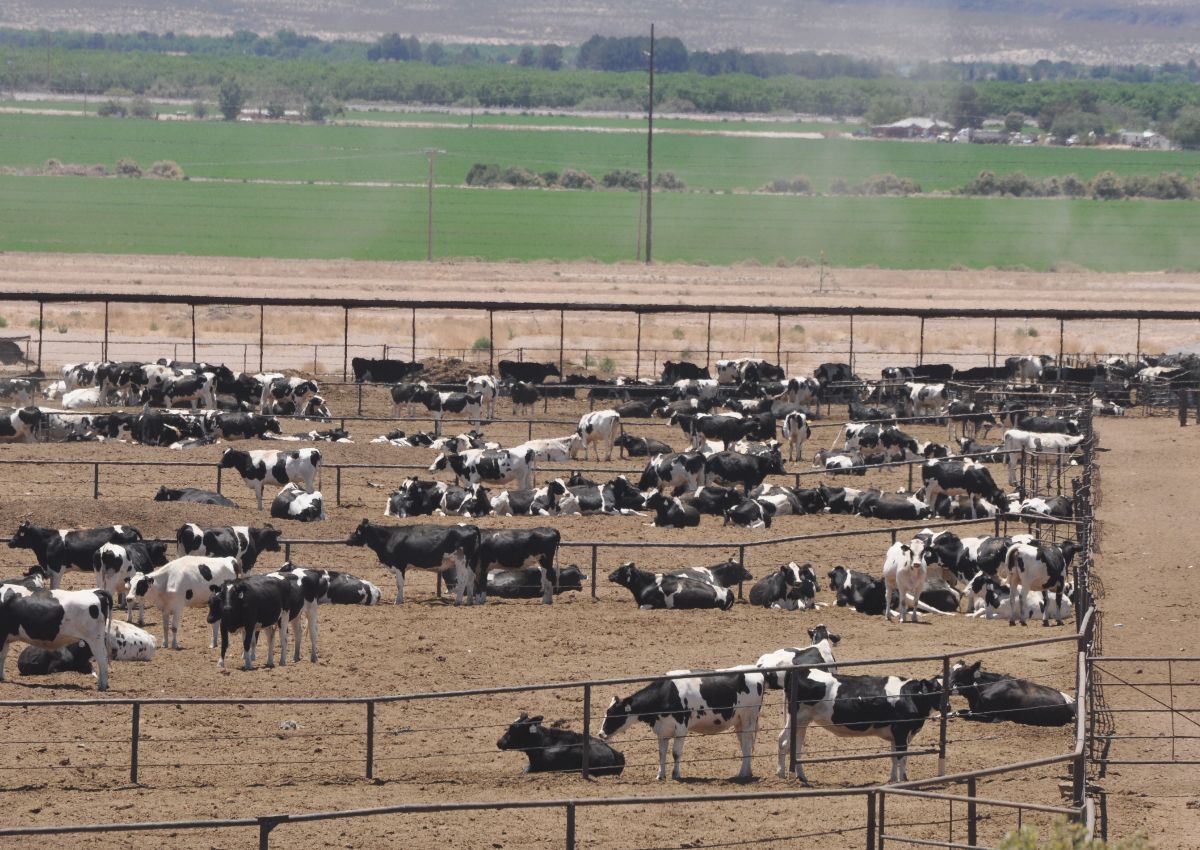
Concentrated animal feeding operations house many of the animals raised for meat, eggs and dairy products. In these facilities, hundreds or thousands of cattle, swine, chickens, turkeys and other animals are confined in large buildings or, in the case of cattle, in open feedlots. (See Figure 1.)
Figure 1. An image of a cattle feedlot in California’s Central Valley.
According to EWG’s analysis of data from the California EPA’s State Water Resources Control Board website, the 1,062 CAFOs house 76.8 million animals. (See Figure 2.)
Only the largest animal feeding operations are considered CAFOs and require a National Pollutant Discharge Elimination System permit from the federal EPA. To be designated a CAFO, an animal facility must have 1,000 or more “animal units,” a generic term that tries to equate animal numbers across different animal types. According to this formula, 1,000 animal units in a facility equals 1,000 cows or 2,500 hogs or 30,000 broiler chickens.
EWG only looked at facilities that are large enough to be considered CAFOs by the EPA.
In California, 812 smaller facilities house 7.5 million animals.
Figure 2. A map of all California CAFO locations.
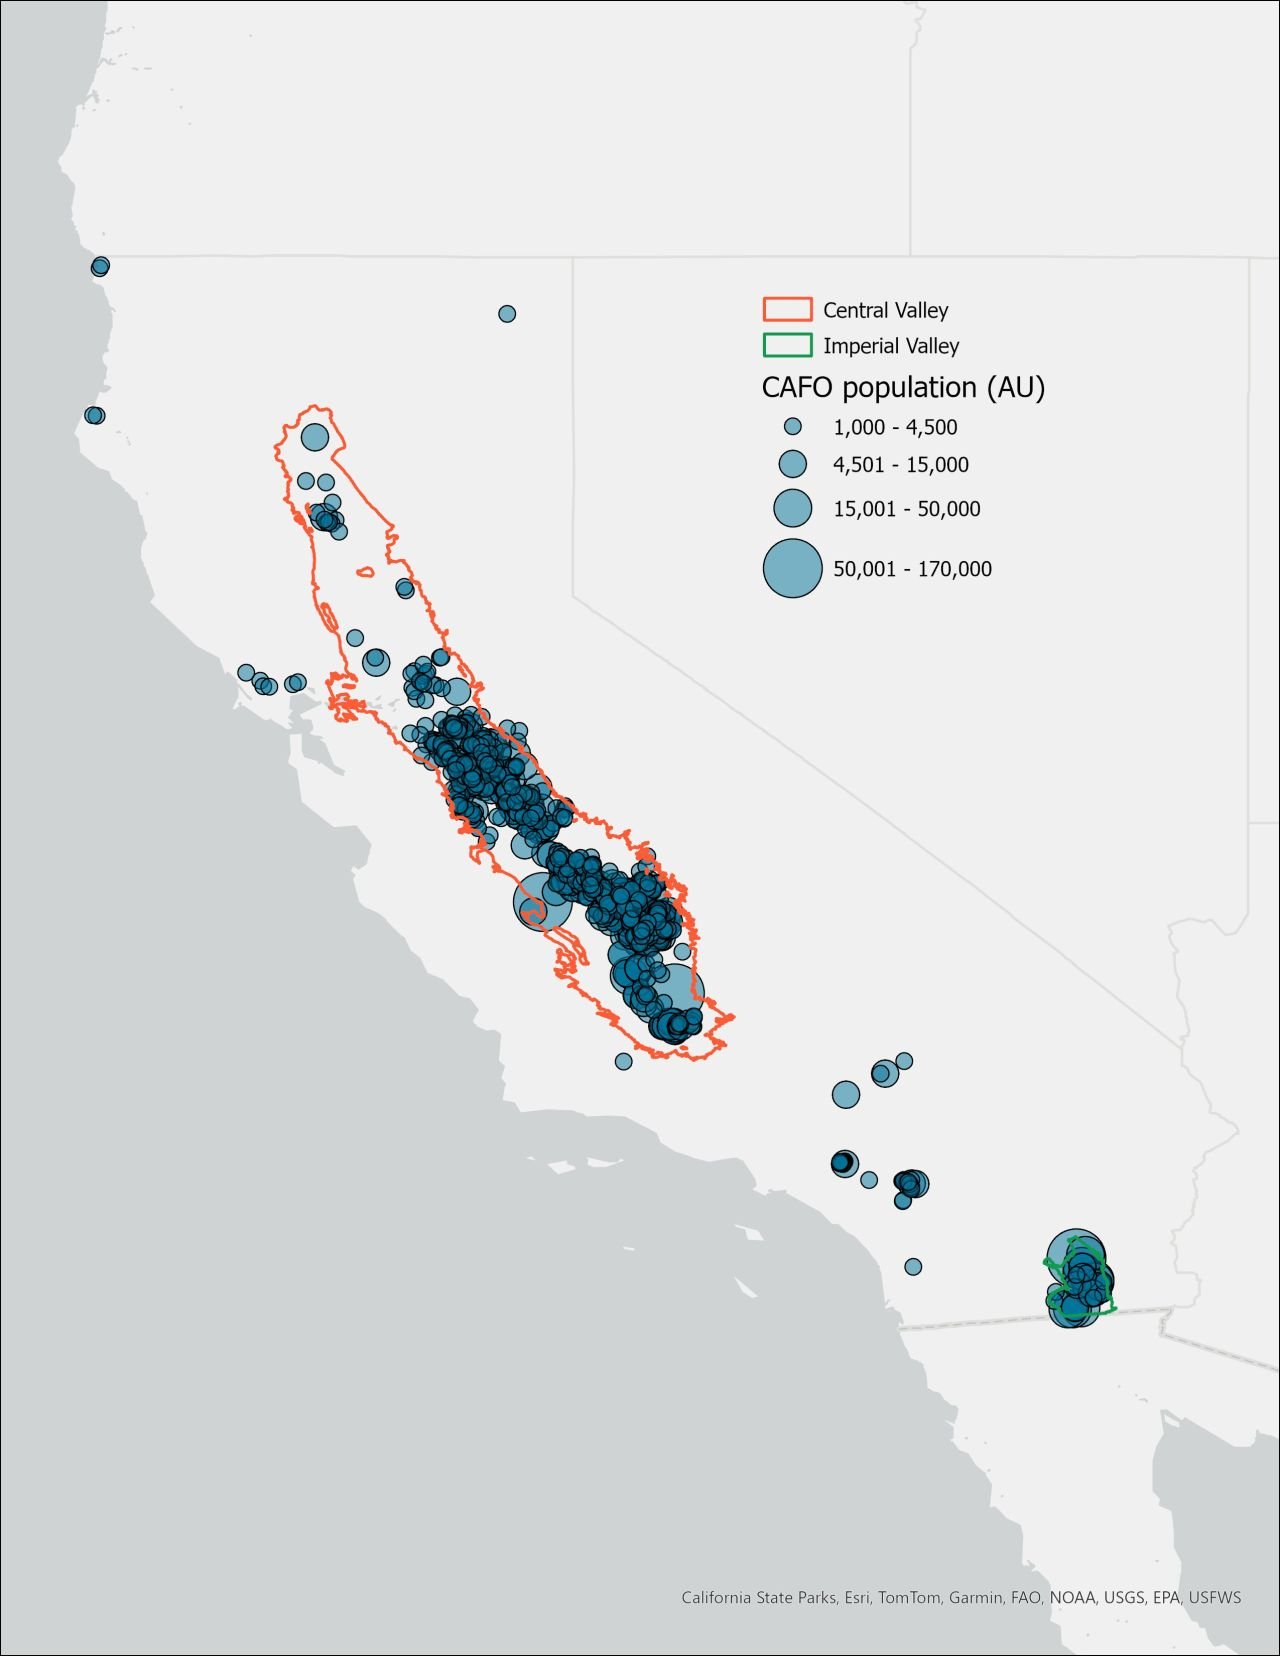
Source: EWG, from California EPA’s State Water Resources Control Board.
Most California CAFOs produce cattle, with 911 cattle operations housing three million cows. Many of the other CAFOs are poultry, with 150 facilities housing 73.8 million chickens, ducks and turkeys.
Of all 1,062 CAFOs, 986, or 93 percent, are located within 1 mile of a canal. Of the 911 cattle operations, 847 are within 1 mile of a canal. (See Figure 3.)
Figure 3. Number of California’s CAFOs and animals by animal type, and percent within 1 mile of a canal.
| CAFO type | Total facilities | Animal count | Facilities within 1 mile of canal | Percent of CAFOs within 1 mile of a canal |
| Cattle | 911 | 3,000,829 | 847 | 93 |
| Poultry | 150 | 73,816,570 | 138 | 92 |
| Other | 1 | 54,000 | 1 | 100 |
| All | 1,062 | 76,871,399 | 986 | 93 |
Source: EWG, from California EPA’s State Water Resources Control Board.
The closer a CAFO is to a body of water, the higher the risk for contamination. The presence of open manure storage tanks and feedlots close to an irrigation canal – sometimes only feet away – makes it easy for bacteria and other contaminants to end up in water sprayed on food crops.
Many of California’s animal facilities are much closer than 1 mile to an irrigation canal. Of the 1,062 CAFOs, 42 percent, or 449 facilities, are within a quarter of a mile of a waterway.
Figure 4 shows two animal operations on opposite banks of an irrigation canal (shown in blue). Together these facilities house over 1,500 dairy cows. Facility 1 has cattle feedlots just 35 feet from the irrigation canal, and at Facility 2, open lagoons hold thousands of gallons of manure about 50 feet away from the canal.
Figure 4. Two animal facilities next to irrigation canals in the Central Valley, with facilities outlined in orange and irrigation canals indicated by blue.
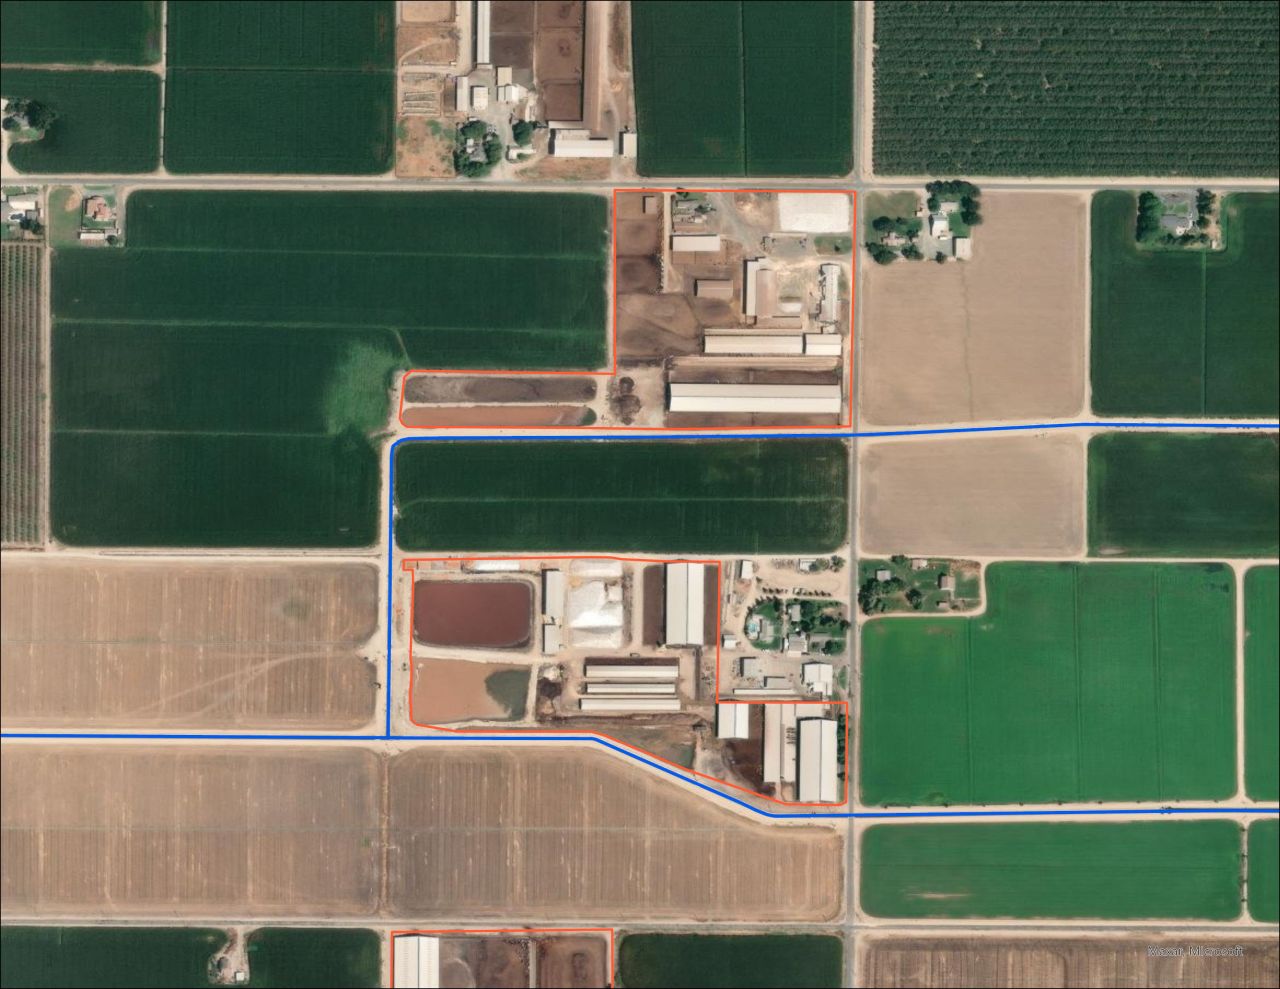
Source: EWG, from ESRI imagery – Maxxar, Microsoft.
The hazard posed to irrigation canals by animal manure is compounded in the Central and Imperial valleys due to the high concentration of operations in small areas of land.
For example, in an expanded view of the same facilities (see Figure 5), it is easy to see far more than two facilities close to the canal system.
In Figure 5, the facilities from the previous image are highlighted by a yellow box on the left side. It also shows another 16 facilities highlighted in orange. Of those facilities, seven are located within 50 feet of a canal.
Figure 5. Zoomed out view of above image, with CAFOs outlined in orange and irrigation canals indicated in blue.
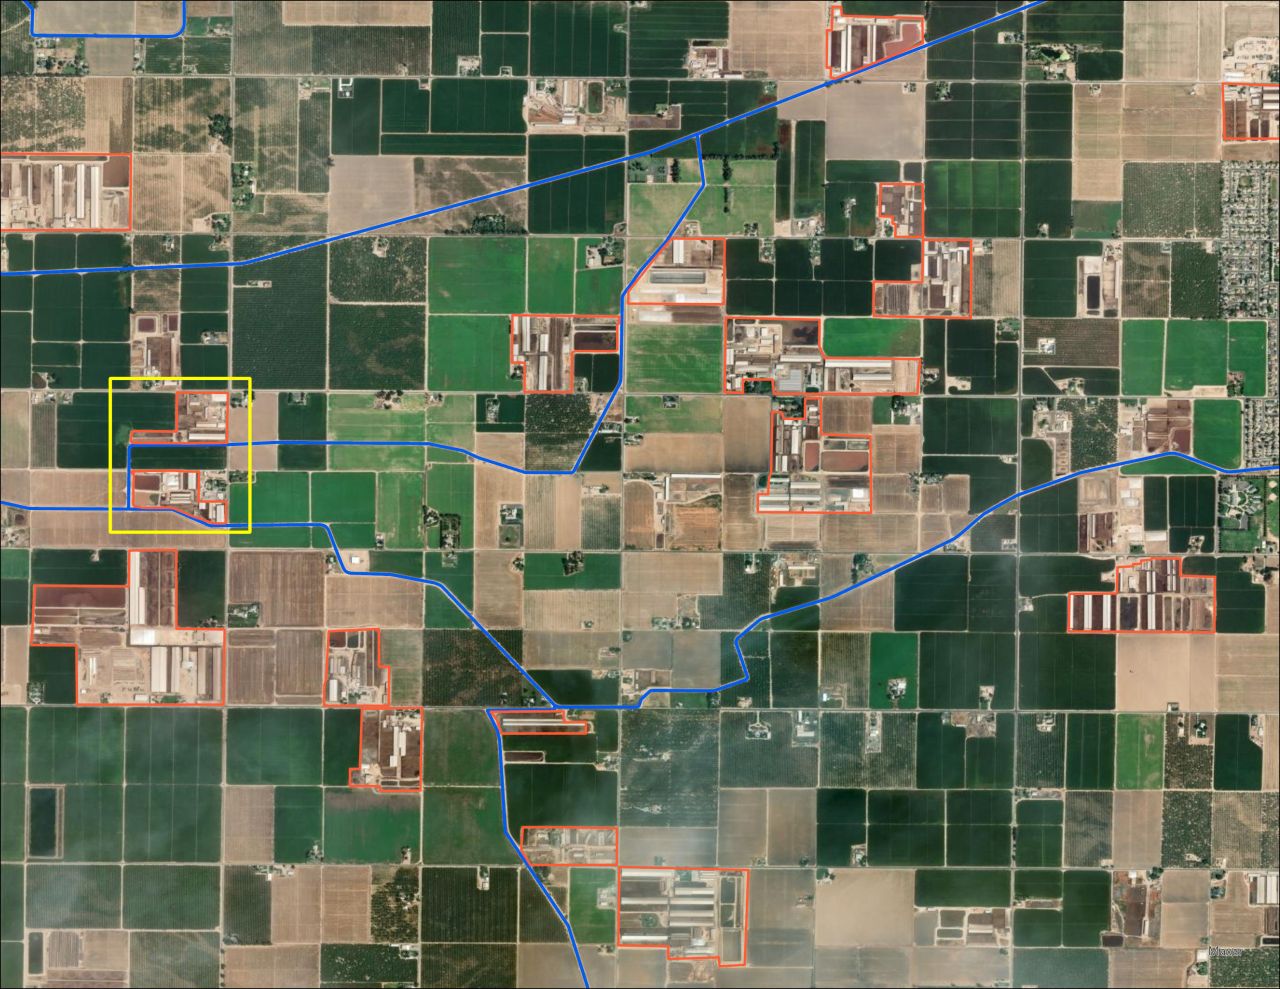
Source: EWG, from ESRI imagery – Maxxar, Microsoft.
Many acres of food crops grown near CAFOs
Manure-contaminated leafy greens are a well-known source of foodborne illness. For example, one large CAFO near thousands of acres of leafy greens fields in Arizona’s Yuma County likely contributed to a recent E. coli outbreak.
In California, thousands of CAFOs are located near farm fields – especially in the Central and Imperial valleys – many of which are planted with fruits and vegetables. Research shows that pollutants from animal feeding operations can cause respiratory damage in residents up to four miles away.
We found that 2.6 million acres of crop fields in California are within 3 miles of at least one CAFO, and 1.56 million of these acres are planted with fruits or vegetables.
In 2022, over 251,000 acres in California were planted with leafy greens or melons, two crops that have recently been the source of bacterial foodborne illness outbreaks. Only 5.2 percent of those fields are within 3 miles of a CAFO, but that still corresponds to over 24,000 acres. (See Figure 6.)
Figure 6. Map of the Imperial Valley showing CAFOs, irrigation canals, and fields of leafy greens and melons.
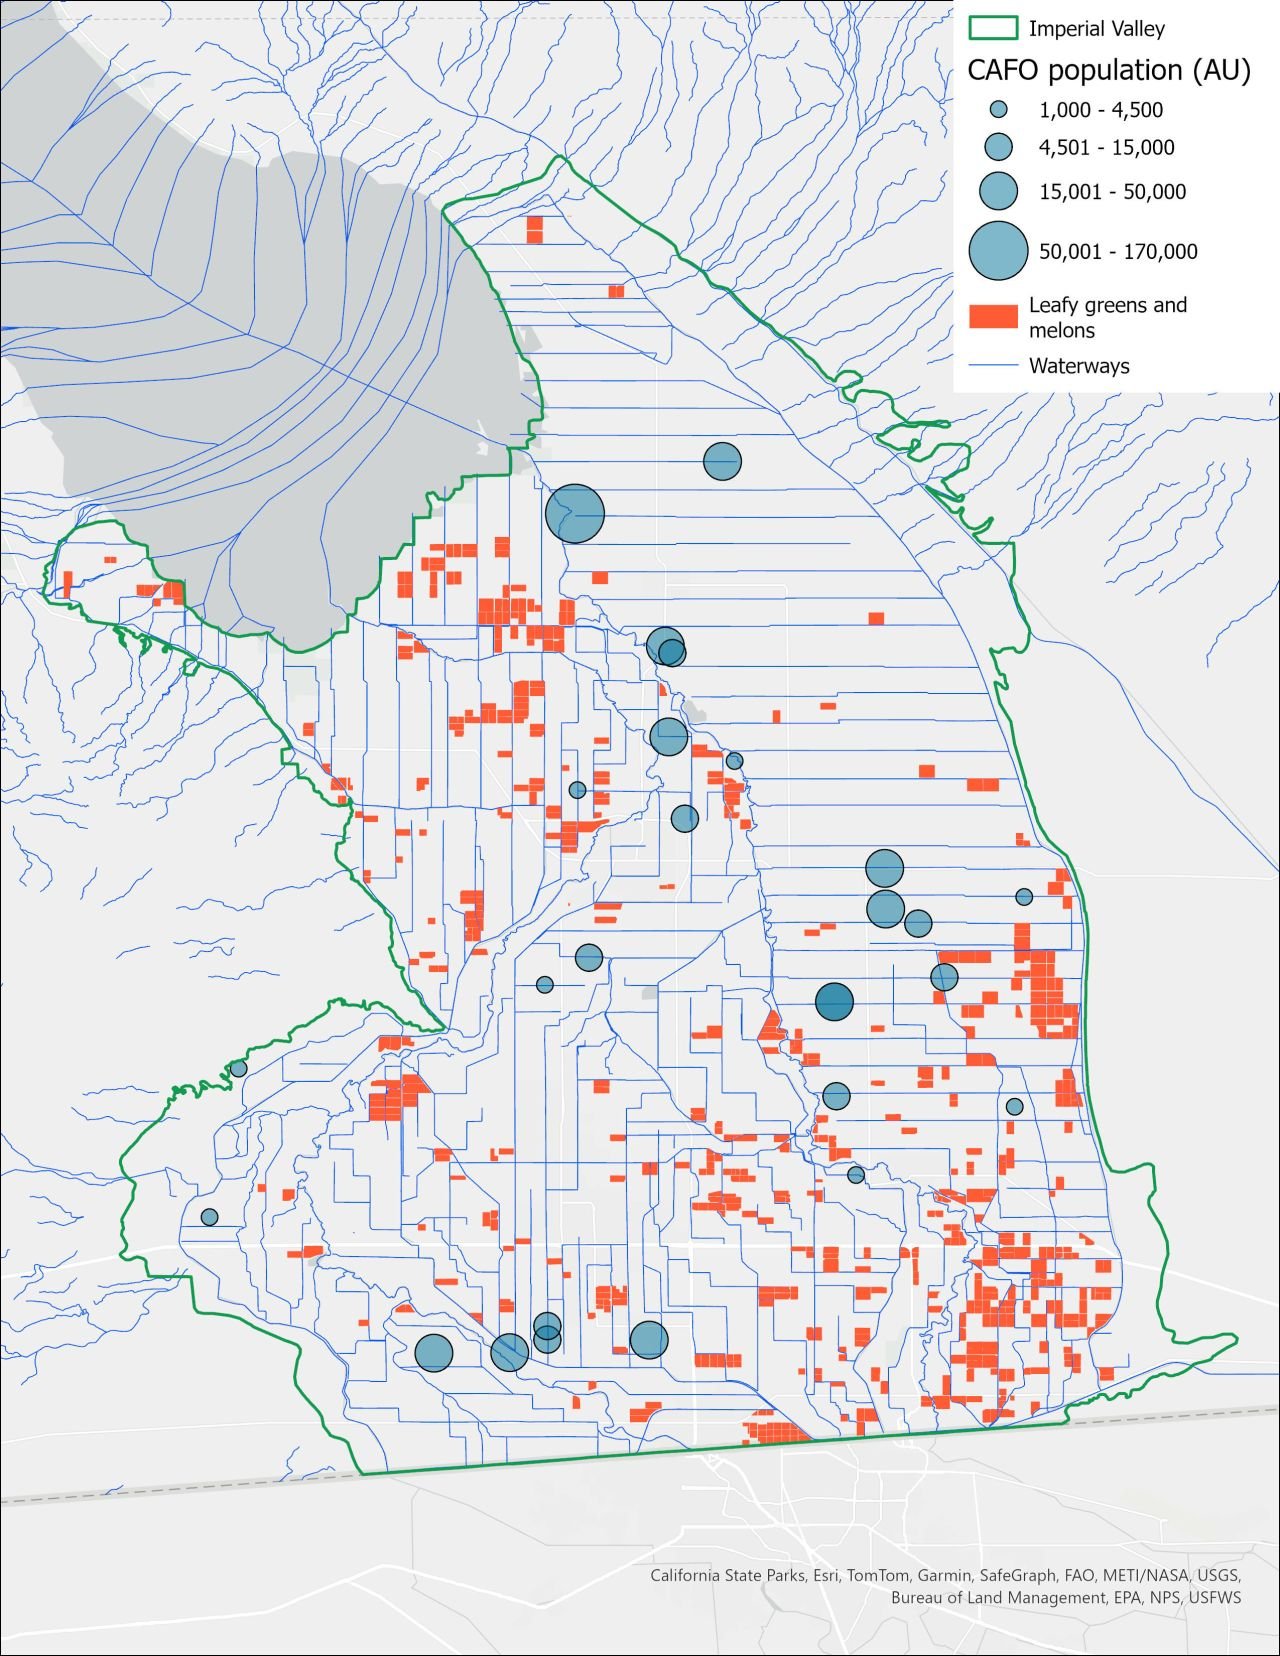
Source: EWG, from Land IQ, Land Use Mapping.
When we zoomed in to fields within a quarter mile of a CAFO – which are at a higher risk for fecal bacteria contamination – our analysis found 1.8 million acres of crop fields and 54,000 acres that grow fruits and vegetables.
How manure contaminants spread to crops
The FDA and the Centers for Disease Control and Prevention believe there are two likely pathways through which bacteria contaminate crops. One is when dust from feedlots drifts onto fields. The other, the focus of this analysis, is when bacteria washes or drifts into irrigation water that is then sprayed on farm fields. (See Figure 7.)
Figure 7. Image of cattle in a feedlot and the dust they stir up.
Without knowing whether the water is contaminated, farmers who cultivate land near CAFOs use the canal water to irrigate their crops. Once harvested, the contaminated crops may get shipped and consumed almost anywhere in the U.S. – and even beyond.
E. coli is a bacteria that can be found in human and animal waste and is often linked to food outbreaks. While there are many strains of E. coli that are not harmful to humans when ingested, some can cause severe gastrointestinal issues or even death when consumed.
Cooking food can kill pathogens, but fruits and vegetables are often consumed raw, making the bacteria on these crops particularly dangerous.
Outbreaks of bacteria on food are occurring more often. In late 2023, a widespread outbreak of salmonella on cantaloupe sickened over 400 people and killed six.
And E. coli outbreaks on vegetables such as lettuce have occurred many times in recent decades. In 2018, five people died and hundreds were sickened when they consumed lettuce contaminated with E. coli.
Much of the U.S. food supply is grown in California, so crops contaminated with bacteria from the state’s CAFOs can – and do – cause foodborne illness in people across the country.
The risks of inadequate regulation
To protect consumers from bacterial outbreaks on food, the FDA should require testing of irrigation water before it is sprayed on produce.
After a number of E. coli outbreaks from consumption of leafy greens, Congress directed the FDA in 2011 to develop standards for irrigation water sprayed on crops. In 2015, the FDA first issued a rule requiring enforceable periodic testing for contaminated irrigation water.
A revised rule, proposed in 2022, abandoned the requirement to test irrigation water, allowing farms instead to voluntarily decide if they want to include tests in their “water assessments.”
The FDA finalized this rule in May 2024. It requires farmers to conduct water testing to assess risks to their water source, including animal manure.
But corrective actions are only required if the grower identifies risks.
In other words, the FDA relies on farmers to regulate themselves.
Other agencies can tackle the CAFO water contamination problem. The EPA could more rigorously monitor the CAFOs’ manure production and management.