Many counties where federal crop insurance subsidies rose between 2008 and 2012 also had an increase in poverty over that period, a finding that undermines the oft-repeated arguments that farm subsidies help reduce rural poverty, an Environmental Working Group analysis shows.
The counties that saw the largest increases in crop insurance subsidies – as well as high rates of poverty – are in districts represented by three leaders of the House-Senate conference negotiating a final farm bill: Reps. Frank Lucas (R-Okla.), Michael Conaway (R-Texas) and Randy Neugebauer (R-Texas). Another district that had a large subsidy increase along with a high poverty rate is represented by House Majority Whip Kevin McCarthy (R-Calif.).
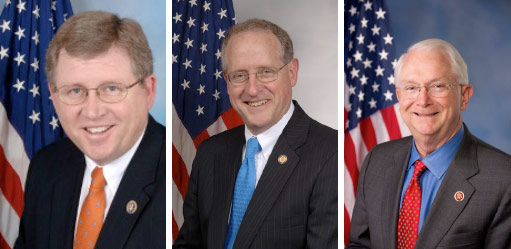
Left to right: Reps. Lucas, Conaway, Neugebauer
All three farm bill conferees voted to cut $39 billion from the Supplemental Nutrition Assistance Program (SNAP), formerly known as food stamps, and to defeat proposals to reduce and reform crop insurance subsidies.
While poverty rates and SNAP participation have risen nationwide, large farm businesses are enjoying record income, according to the U.S. Department of Agriculture. Nevertheless, taxpayer-funded crop insurance premium subsidies grew from $5.7 billion in 2008 to more than $7 billion in 2012. Billions more went directly to insurance companies to subsidize their operating expenses and payouts for crop losses – totaling more than $14 billion last year alone. During the 2008-2012 span, net farm income increased from $83.7 billion to $113.8 billion.
Nationwide, three of every four counties benefited from an increase in premium subsidy support between 2008 and 2012. What’s more, nearly all the counties that received the largest increases had poverty rates higher than the national average.
This interactive map shows the growth in crop insurance premium subsidies over the past four years and the change in poverty rates from 2003 to 2011 for every U.S. county. Click on a county to see the local trends.
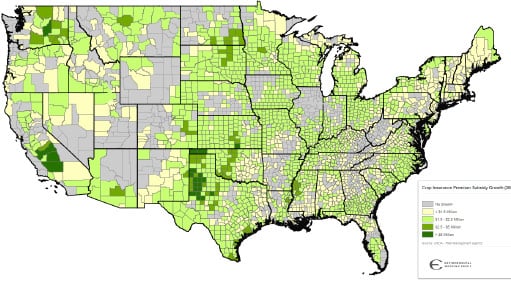
https://a.tiles.mapbox.com/v3/ewg.wqwr8uxr/page.html?secure=1#5/40.847/-97.6904
Many of the counties that enjoyed the largest increases in crop insurance subsidies are in western Texas and are represented by Reps. Neugebauer and Conaway. From 2008 to 2012, the subsidies rose by $118 million in Neugebauer’s district, and by $40 million in Conaway’s. The poverty rate also rose in both districts and consistently exceeded the national average in most areas.
In the counties represented by Chairman Lucas, farmers received a $64 million increase in premium subsidies over the same 2008-2012 period. The subsidies rose in every county in his district – in two of them by more than $5 million. Meanwhile, poverty increased in two-thirds of the counties Lucas represents.
Click below to expand the chart and see how all 32 House members of the farm bill conference committee voted on increasing subsidies, reforming crop insurance and cutting SNAP funding, along with the trend in premium subsidies and the number of SNAP beneficiaries in that district.
|
House Farm Bill Conferees |
Vote on increasing farm subsidies (passed 216 - 208) |
Vote on reforming crop insurance (failed 208 - 217) |
Net increase in crop insurance premium subsidies in district 2008-2012 |
Vote on cutting SNAP by $39 billion (passed 217 - 210) |
Number of SNAP participants in district |
|
Rep. Dave Camp (R-Mich.) |
Yea |
Nay |
Y |
Yea |
138,000 |
|
Rep. Michael Conaway (R-Texas) |
Yea |
Nay |
Y |
Yea |
93,000 |
|
Rep. Jim Costa (D-Calif.) |
Nay |
Nay |
Y |
Nay |
82,000 |
|
Rep. Rick Crawford (R-Ark.) |
Yea |
Nay |
Y |
Yea |
163,000 |
|
Rep. Rodney Davis (R-Ill.) |
Yea |
Nay |
Yea |
178,000 |
|
|
Rep. Suzan DelBene (D-Wash.) |
Nay |
Nay |
Y |
Nay |
111,000 |
|
Rep. Jeff Denham (R-Calif.) |
Yea |
Nay |
Y |
Nay |
200,000 |
|
Rep. Eliot Engel (D-N.Y.) |
Nay |
Yea |
Y |
NV |
118,000 |
|
Rep. Marcia Fudge (D-Ohio) |
Nay |
Yea |
Nay |
344,000 |
|
|
Rep. Sam Johnson (R-Texas) |
Yea |
Yea |
Y |
Yea |
44,000 |
|
Rep. Steve King (R-Iowa) |
Yea |
Nay |
Yea |
91,000 |
|
|
Rep. Sandy Levin (D-Mich.) |
Nay |
Yea |
Y |
Nay |
254,000 |
|
Rep. Frank Lucas (R-Okla.) |
Yea |
Nay |
Y |
Yea |
124,000 |
|
Rep. Tom Marino (R-Pa.) |
Yea |
Nay |
Yea |
144,000 |
|
|
Rep. Jim McGovern (D-Mass.) |
Nay |
Yea |
Nay |
99,000 |
|
|
Rep. Mike McIntyre (D-N.C.) |
Nay |
Nay |
Y |
Nay |
99,000 |
|
Rep. Gloria Negrete McLeod (D-Calif.) |
NV |
Nay |
Y |
Nay |
367,000 |
|
Rep. Randy Neugebauer (R-Texas) |
Yea |
Nay |
Y |
Yea |
110,000 |
|
Rep. Kristi Noem (R-S.D.) |
Yea |
Nay |
Y |
Yea |
105,000 |
|
Rep. Collin Peterson (D-Minn.) |
Nay |
Nay |
Y |
Nay |
70,000 |
|
Rep. Martha Roby (R-Ala.) |
Yea |
Nay |
Y |
Yea |
156,000 |
|
Rep. Mike Rogers (R-Ala.) |
Yea |
Nay |
Y |
Yea |
179,000 |
|
Rep. Ed Royce (R-Calif.) |
Yea |
Yea |
Yea |
100,000 |
|
|
Rep. Kurt Schrader (D-Ore.) |
Nay |
Yea |
Y |
Nay |
164,000 |
|
Rep. Austin Scott (R-Ga.) |
Yea |
Nay |
Y |
Yea |
207,000 |
|
Rep. Steve Southerland (R-Fla.) |
Yea |
Nay |
Y |
Yea |
137,000 |
|
Rep. Glenn Thompson (R-Pa.) |
Yea |
Nay |
Y |
Yea |
74,000 |
|
Rep. Filemon Vela (D-Texas) |
Nay |
Nay |
Y |
Nay |
446,000 |
|
Rep. Tim Walz (D-Minn.) |
Nay |
Nay |
Y |
Nay |
70,000 |
Sources: Library of Congress; USDA